

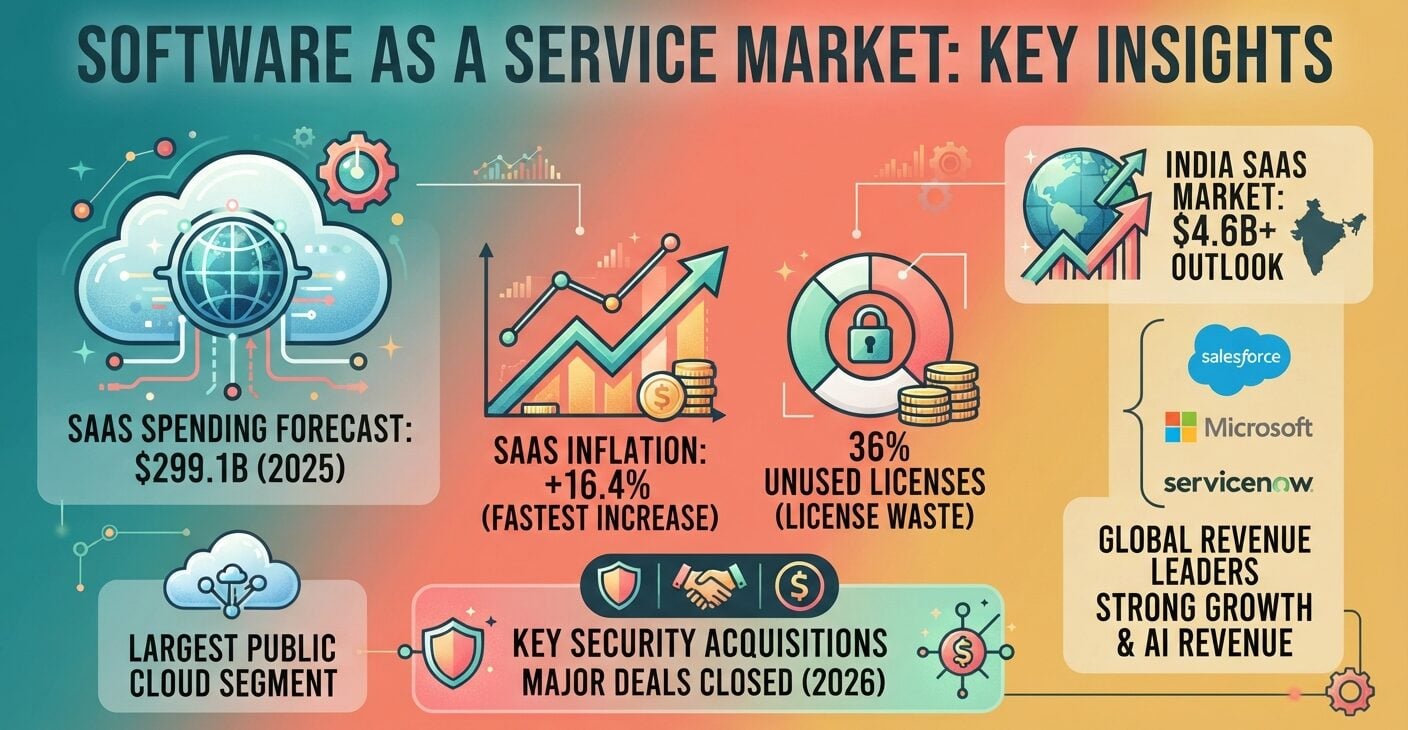
Gartner forecast $299.1 billion in end-user spending on cloud application services for 2025. Vertice measured SaaS price inflation at 16.4% in June 2026.
This software as a service market report covers spending forecasts, vendor revenue, AI-linked income, license waste, India’s outlook, and three security deals that closed in 2026.
Software as a Service Market
How Big Is the Software as a Service Market by Gartner’s Count?
Gartner forecast end-user spending on cloud application services (SaaS) at $299.1 billion in 2025, up 19.2% from $250.8 billion in 2024. SaaS was the largest of the four public cloud segments in Gartner’s table.
Infrastructure services grew faster. IaaS spending was forecast to rise 24.8% in 2025 and PaaS 21.6%.
| Segment | 2024 spending | 2024 growth | 2025 spending | 2025 growth |
|---|---|---|---|---|
| Cloud Application Services (SaaS) | $250,804M | 18.1% | $299,071M | 19.2% |
| Cloud System Infrastructure Services (IaaS) | $169,818M | 21.3% | $211,856M | 24.8% |
| Cloud Application Infrastructure Services (PaaS) | $171,565M | 19.1% | $208,644M | 21.6% |
| Cloud Desktop-as-a-Service (DaaS) | $3,466M | 7.7% | $3,849M | 11.1% |
| Total public cloud | $595,652M | 19.2% | $723,421M | 21.5% |
Source: Gartner, Worldwide Public Cloud Services End-User Spending Forecast, November 2024 edition (2024–2025)
These figures measure end-user spending, not vendor revenue. Gartner’s newer worldwide cloud updates sit behind its client paywall.
2026 Forecasts for the Software as a Service Market
Gartner’s July 2026 forecast puts worldwide software spending at $1.468 trillion in 2026, up 15.5%. That line covers all software, and the release does not break out SaaS.
| Segment | 2025 spending | 2026 spending | 2026 growth |
|---|---|---|---|
| Data Center Systems | $506B | $822B | 62.5% |
| Infrastructure as a Service (IaaS) | $222B | $287B | 29.3% |
| Software | $1,271B | $1,468B | 15.5% |
| Devices | $790B | $868B | 9.8% |
| Services | $1,492B | $1,570B | 5.3% |
| Communications Services | $1,296B | $1,354B | 4.4% |
| Overall IT | $5,577B | $6,369B | 14.2% |
Source: Gartner, Worldwide IT Spending Forecast, July 2026 (2025–2026)
Vendor guidance runs below that 15.5% line for the largest suppliers. Salesforce guides fiscal 2027 revenue to $46.1–46.4 billion, up 11–12%, conditional on closing its Contentful and Fin deals.
Source: Salesforce, Q2 fiscal 2027 results, August 2026
Workday expects fiscal 2027 subscription revenue of $9.925–9.950 billion, up 12–13%. SAP’s 2026 outlook is €25.8–26.2 billion in cloud revenue at constant currencies, up 23–25%.
Source: Workday, fiscal 2026 results, February 2026; SAP, Q1 2026 quarterly statement, April 2026
SaaS Prices Rose 16.4% in June 2026
Vertice’s SaaS inflation rate climbed from 12.1% in April 2026 to 14.2% in May and 16.4% in June. The June reading passed the previous high of 14.7% from November 2025.
Vertice calls the 4.3-point rise in two months the fastest increase it has recorded. The same page compares the June rate with a US CPI of 4.2%.
Source: Vertice, SaaS inflation rate, April–June 2026 (based on over $75bn of processed spend)
| Period | SaaS cost per employee |
|---|---|
| 2023 | $7,900 |
| 2024 | $8,700 |
| End of 2025 | About $9,100 |
Source: Vertice, SaaS Inflation Index 2026 Report, 2023–2025
How Much SaaS Spend Goes to Waste?
Organizations leave an average of 36% of SaaS licenses unused, measured against industry-recommended utilization, according to Zylo’s 2026 SaaS Management Index. The median SaaS spend per employee is $9,455.
In a survey of 218 IT leaders, 78% reported unexpected charges tied to consumption-based or AI pricing in the prior 12 months. Business units control 81% of SaaS spend, while IT directly manages 15%.
Source: Zylo, 2026 SaaS Management Index, January 2026 (40M+ licenses, $75B spend under management)
Revenue Leaders in the Software as a Service Market
Each figure below is the vendor’s own reported metric for its own fiscal period. Revenue definitions differ, so the numbers are listed separately rather than ranked.
Salesforce and Microsoft
Salesforce reported fiscal 2026 revenue of $41.5 billion, up 10%, including a $399 million Informatica contribution. Q2 fiscal 2027 revenue reached $11.3 billion, up 11%.
Source: Salesforce, fiscal 2026 results (year to January 31, 2026) and Q2 fiscal 2027 results (quarter to July 31, 2026)
Microsoft Cloud revenue was $59.3 billion in the quarter ended June 30, 2026, up 27%. That total also includes Azure infrastructure, so it is broader than SaaS.
Within it, Microsoft’s Microsoft 365 Commercial cloud revenue grew 14% as reported. Microsoft 365 Copilot passed 30 million paid seats.
Source: Microsoft, Q4 fiscal 2026 results, July 2026
SAP, Adobe and Workday
SAP’s cloud revenue rose 23% to €21.02 billion in 2025, with Cloud ERP Suite at €18.12 billion, up 28%. Total revenue was €36.80 billion.
Source: SAP, Q4 and FY 2025 quarterly statement, January 2026
Revenue at Adobe reached $23.77 billion in fiscal 2025, up 11%. Total Adobe ARR exited the year at $25.20 billion.
Source: Adobe, fiscal 2025 results (year to November 2025)
Fiscal 2026 subscription revenue at Workday was $8.833 billion, up 14.5%, on total revenue of $9.552 billion.
Source: Workday, fiscal 2026 results (year to January 31, 2026)
ServiceNow Subscription Revenue by Quarter
ServiceNow posted $3,877 million in Q2 2026 subscription revenue, up 24.5% year over year. Full-year 2025 subscription revenue was $12.88 billion, up 21%.
Source: ServiceNow, quarterly results, Q4 2025 to Q2 2026
How Much SaaS Revenue Comes From AI Products?
Salesforce put Agentforce ARR at $800 million at the end of fiscal 2026, up 169%. Agentforce and Data 360 ARR combined exceeded $2.9 billion, including $1.1 billion of Informatica Cloud ARR.
Source: Salesforce, fiscal 2026 results, February 2026
ServiceNow AI crossed $1 billion in annual contract value in Q2 2026.
Source: ServiceNow, Q2 2026 results, July 2026
On the buyer side, spend on AI-native apps rose 108% year over year in Zylo’s data, and 393% in organizations with more than 10,000 employees. ChatGPT is now the most expensed application.
Source: Zylo, 2026 SaaS Management Index, January 2026
India’s Software as a Service Market: $4.637 Billion in 2026
| Segment | 2025 spending | 2025 growth | 2026 spending | 2026 growth |
|---|---|---|---|---|
| PaaS | $5,114M | 22.1% | $6,414M | 25.4% |
| IaaS | $4,470M | 34.9% | $6,259M | 40.0% |
| SaaS | $3,901M | 16.7% | $4,637M | 18.9% |
| DaaS | $171M | 4.9% | $176M | 2.9% |
| Total | $13,656M | 24.0% | $17,487M | 28.1% |
Source: Gartner, India Public Cloud Services End-User Spending Forecast, June 2026 (2025–2026)
SaaS ranks third of four segments in India’s 2026 cloud forecast. Gartner analyst Arunasree Cheparthi said enterprises “optimize licenses, rationalize usage” and shift new spending toward infrastructure and platforms.
Three Security Deals Closed Between February and April 2026
Palo Alto Networks completed its CyberArk acquisition on February 11, 2026. The July 2025 announcement valued CyberArk’s equity at about $25 billion, and the company’s 10-Q records total purchase consideration of $21.1 billion.
Source: Palo Alto Networks, deal announcement (July 2025) and Form 10-Q (quarter to April 30, 2026)
Google closed its all-cash purchase of Wiz on March 11, 2026, at $32 billion subject to closing adjustments. Wiz joined Google Cloud.
Source: Google, deal completion, March 2026
ServiceNow completed its roughly $7.75 billion cash acquisition of Armis on April 20, 2026. Armis sells cyber exposure management across IT, OT, IoT, and medical devices.
Source: ServiceNow, deal completion, April 2026
FAQs
How big is the SaaS market?
Gartner forecast $299.1 billion in end-user spending on cloud application services (SaaS) for 2025, up 19.2% from $250.8 billion in 2024. That figure measures buyer spending, not vendor revenue.
What is the SaaS inflation rate in 2026?
Vertice recorded 16.4% SaaS inflation in June 2026, its highest monthly reading. The rate was 12.1% in April and 14.2% in May, based on over $75 billion of processed spend.
How much do companies spend on SaaS per employee?
Zylo’s 2026 index puts median SaaS spend at $9,455 per employee. Vertice reports a separate figure of about $9,100 per employee at the end of 2025, up from $8,700 in 2024.
How fast is SaaS spending growing in India?
Gartner forecasts Indian SaaS spending to grow 18.9% to $4.637 billion in 2026. IaaS (40.0%) and PaaS (25.4%) are forecast to grow faster in the same release.
What do the numbers say when Reddit users ask whether SaaS is dying?
Reported figures show growth. ServiceNow’s Q2 2026 subscription revenue rose 24.5%, and Salesforce raised fiscal 2027 revenue guidance to $46.1–46.4 billion. Gartner forecast 19.2% SaaS spending growth for 2025.
