


Global ecommerce sales are on track to hit $6.88 trillion in 2026, a 7.2% jump from $6.42 trillion in 2025. Online retail now accounts for 21.1% of all worldwide retail spending, up from 20.5% in 2025. With 2.86 billion people expected to shop online this year and roughly 2,162 new ecommerce stores launching daily, the shift away from physical retail continues to accelerate.
Ecommerce Business Statistics: Key Data Points for 2026
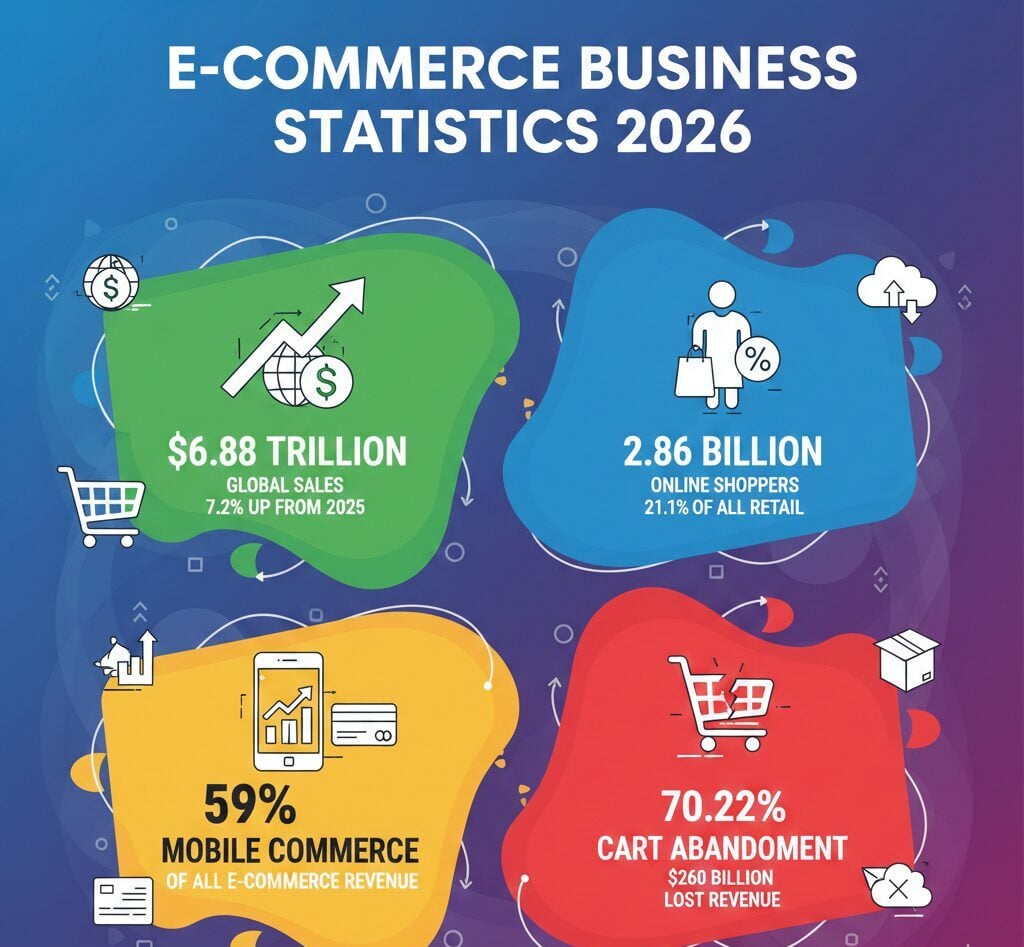
- The global ecommerce market is projected at $6.88 trillion in 2026, growing 7.2% year-over-year.
- Online retail’s share of global sales reached 21.1% in 2026, up from 20.5% in 2025.
- Amazon holds 37.6% of U.S. ecommerce market share, with over 250 million Prime subscribers as of 2025.
- Mobile commerce generated $2.51 trillion globally in 2025, accounting for 59% of all ecommerce revenue.
- Cart abandonment averages 70.22%, with $260 billion in recoverable lost revenue annually across U.S. and EU markets.
Global Ecommerce Market Size and Growth
Ecommerce grew at 8.3% in 2025, nearly three times the 3% growth rate recorded by physical stores. That gap is widening. By 2028, global ecommerce sales are projected to reach $7.89 trillion.
There were 2.77 billion online shoppers worldwide in 2025 — about 33% of the global population. An additional 90 million shoppers are expected to join by the end of 2026. Cross-border ecommerce alone accounted for $2.4 trillion in 2025, and over 28 million ecommerce stores are now operating globally.
Ecommerce Revenue by Country
China dominates with $3.45 trillion in ecommerce revenue and a 47.3% retail penetration rate. Strip China out, and global ecommerce penetration drops from 20.5% to roughly 12.8%. The U.S. is the second-largest market at $1.25 trillion but converts only 15.8% of its retail online. U.S. retail ecommerce hit $310.3 billion in Q3 2025 alone, up 5.1% from Q3 2024.
The fastest-growing markets by percentage are the Philippines (26.5%), India (24.1%), and Indonesia. Latin America leads all regions with 12.2% year-over-year growth, with Southeast Asia close behind.
U.S. Ecommerce Marketplace Share
Amazon processed $167.7 billion in net sales during Q2 2025, a 13% year-over-year increase. Walmart is the fastest-growing competitor, with ecommerce sales up 23% year-over-year in 2024. Shopify powers 29% of all U.S. ecommerce websites and processed $292 billion in gross merchandise volume during 2024.
During Prime Day 2025 (July 8–11), U.S. consumers spent $24.1 billion online — more than double Black Friday 2024’s $10.8 billion.
| Platform | U.S. Market Share (2025) |
|---|---|
| Amazon | 37.6% |
| Walmart | 6.4% |
| Apple | 3.6% |
| eBay | ~3.5% |
| All Others | ~48.9% |
Mobile Ecommerce Statistics
Mobile commerce hit $2.51 trillion globally in 2025 and made up 59% of total ecommerce sales. In the U.S., mobile captured 44.1% of online sales, worth $564.1 billion as of 2024. That share is expected to reach 49.79% by 2027. Mobile wallet users in the U.S. stood at 161.6 million in 2025.
There’s a gap between traffic and conversion. Mobile drove 75% of all ecommerce site visits in March 2025 but produced only 59% of revenue. The average mobile conversion rate sits at 2%, compared to 3% on desktop. Smaller screens, slow-loading pages, and clunky checkout forms continue to drag completion rates down.
Ecommerce Cart Abandonment Rates
The Baymard Institute calculates an average cart abandonment rate of 70.22% across 50 studies as of 2025. That translates to $260 billion in recoverable lost revenue per year for U.S. and EU sites combined. Mobile users abandon at 75.5%–80.2%, while desktop users sit around 66.74%–70%.
The worst performer? Social media traffic, with a 91% abandonment rate — most of those users are browsing, not buying. The top reason for abandonment is extra costs like shipping, taxes, and fees, cited by 47% of users. Required account creation accounts for 25%, and overly complicated checkouts account for 18%. Better checkout design alone can lift conversion rates by 35.26%, per Baymard’s usability research.
Social Commerce Ecommerce Statistics
Over half of U.S. social media users (50.6%) made at least one purchase through a social channel in 2025. U.S. social commerce sales are projected to grow from $67.06 billion in 2023 to $144.52 billion by 2027. The average U.S. social buyer spent $627.80 in 2023, up 86% from $337.70 in 2020.
Only 14% of shoppers start their purchase on social media, compared to 44% on search engines and 41% on online stores like Amazon’s marketplace. That 14% figure is growing as TikTok Shop and Instagram Checkout gain traction. During Prime Day 2025, traffic from AI-powered shopping assistants surged 3,300% year-over-year.
B2B Ecommerce Statistics
B2B ecommerce dwarfs B2C in raw dollar terms. The market hit $32.11 trillion in 2025 and is expected to reach $36.16 trillion by 2026, growing at a 14.5% compound annual rate. That growth rate outpaces B2C by a wide margin.
Three out of four B2B buyers say they’d switch suppliers for a better online purchasing experience. Over 90% of B2B companies adopted virtual sales models since 2020, and U.S. B2B digital channels now account for 56% of total B2B revenue, up from 32% in 2020.
FAQ
How large is the global ecommerce market in 2026?
The global ecommerce market is projected at $6.88 trillion in 2026, up 7.2% from $6.42 trillion in 2025. Online retail accounts for 21.1% of all worldwide retail sales.
Which country leads in ecommerce revenue?
China leads with $3.45 trillion in ecommerce revenue and a 47.3% retail penetration rate. The U.S. ranks second at $1.25 trillion with 15.8% penetration.
What is the average cart abandonment rate?
The average cart abandonment rate is 70.22% as of 2025, according to the Baymard Institute. Mobile abandonment runs higher at 75.5%–80.2%.
How much revenue does mobile commerce generate?
Mobile commerce generated $2.51 trillion globally in 2025, accounting for 59% of total ecommerce revenue. In the U.S., mobile captured $564.1 billion.
How large is B2B ecommerce compared to B2C?
B2B ecommerce reached $32.11 trillion in 2025, roughly five times the size of B2C. It is growing at a 14.5% compound annual rate.