


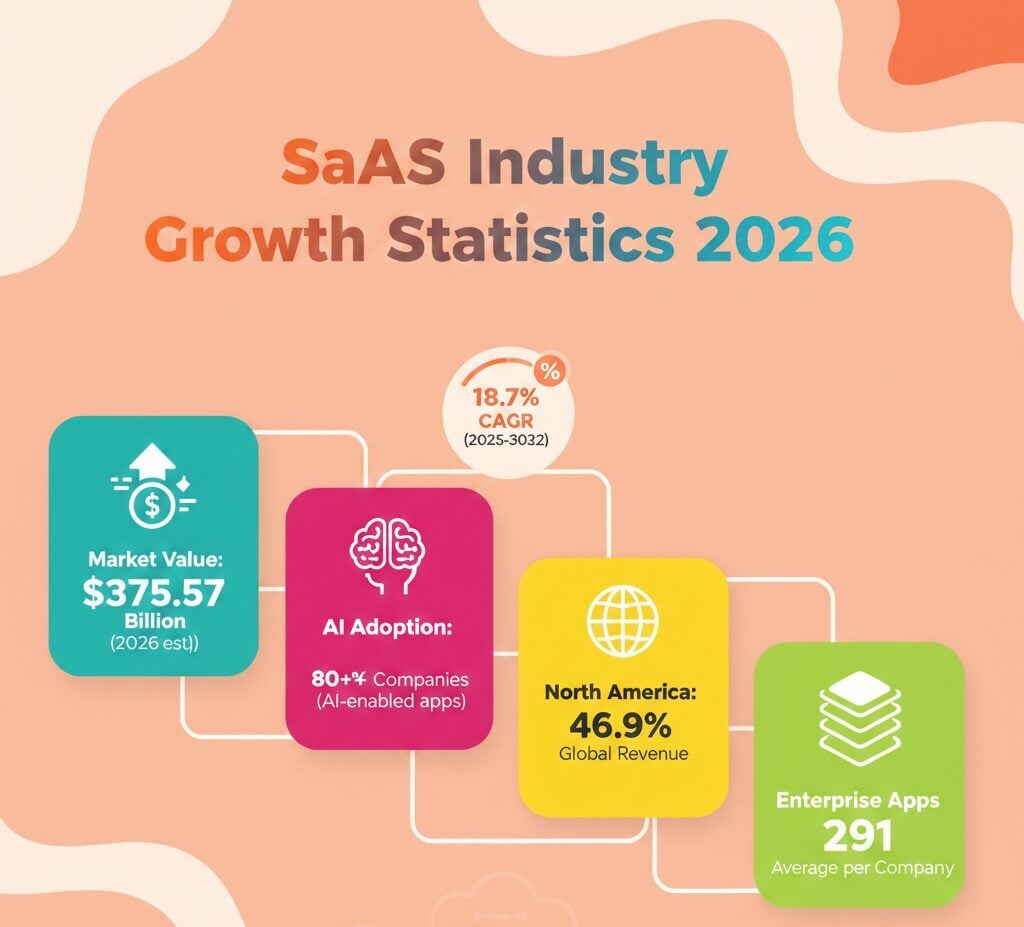
The global SaaS market reached an estimated $315.68 billion in 2025 and is projected to grow to $375.57 billion in 2026, according to Fortune Business Insights. That figure could climb past $1.2 trillion by 2032 at a compound annual growth rate of 18.7%. Over 30,800 SaaS companies now operate worldwide, with roughly 17,000 based in the United States. Enterprises manage an average of 291 SaaS applications each, up from 110 just six years ago.
This article compiles the latest SaaS industry growth statistics for 2026, covering market size, enterprise adoption, AI integration, regional distribution, and spending trends.
SaaS Industry Growth Statistics 2026: Key Statistics
- The global SaaS market is valued at $315.68 billion as of 2025, with a projected 18.7% CAGR through 2032.
- North America accounts for 46.9% of global SaaS revenue, with the U.S. market alone expected to hit $141.06 billion in 2026.
- The average enterprise now manages 291 SaaS applications, up from 254 in 2023.
- Over 80% of companies are expected to deploy AI-enabled apps in their IT environments by 2026, compared to just 5% in 2023.
- SaaS companies accounted for more than 2,600 M&A transactions globally in 2025.
SaaS Industry Growth Statistics: Market Size and Projections
The SaaS market has grown at a rapid clip over the past decade. From $273.55 billion in 2023, the global market expanded to $315.68 billion in 2025. Fortune Business Insights projects it will reach $375.57 billion in 2026 and $1,482.44 billion by 2034.
Worldwide SaaS revenue is expected to grow at an annual rate of 19.38% between 2025 and 2029, reaching $793.10 billion by the end of that period. End-user spending on public cloud services hit $723.4 billion in 2025, up from $595.7 billion the prior year. SaaS remains the single largest category within public cloud spending.
The B2B SaaS segment alone was valued at $390 billion in 2025. It is estimated to grow from $492.34 billion in 2026 to $1,578.2 billion by 2031 at a CAGR of 26.24%, driven by AI copilots, cloud-first budgets, and usage-based pricing models.
SaaS Industry Growth by Region in 2026
North America held a 46.9% share of global SaaS revenue in 2025, the largest of any region. The U.S. alone is home to roughly 17,000 SaaS companies and is expected to generate $141.06 billion in SaaS revenue in 2026. Canada adds another 2,000 companies to the region’s total.
Europe is growing steadily. Germany’s SaaS market stands at $14.81 billion, France at $13.19 billion, and the U.K. at $12.93 billion as of 2026 projections. According to European Commission data, 63% of European SMEs use at least one cloud-based application. The Asia-Pacific region posts the fastest regional CAGR, with India’s SaaS industry projected to reach $50 billion by 2030. The GCC market in the Middle East was valued at $7.14 billion in 2025.
SaaS Industry Growth Statistics: Enterprise Adoption
Enterprise reliance on SaaS tools has grown sharply. The average enterprise managed 291 SaaS applications in 2026, compared to 254 in 2023 and 110 in 2020. Large organizations with 10,000 or more employees average 473 applications, while mid-market companies (1,000 to 10,000 employees) average 217.
Shadow IT compounds the problem. Untracked applications add an estimated 30% to 40% on top of officially managed software. More than 60% of apps in use remain unsanctioned, with ChatGPT ranking as the top unsanctioned IT application according to Zylo’s 2026 SaaS Management Index.
About 81% of organizations have automated at least one business process using SaaS applications. SaaS spend per employee has increased to $5,607 annually, a 7% rise from 2023. At the same time, 42% of organizations have cut SaaS budgets due to economic uncertainty, pushing companies toward optimizing existing tools instead of buying new ones.
SaaS License Waste and Optimization
One of the most striking SaaS industry growth statistics involves waste. An estimated 51% of SaaS licenses purchased by enterprises go unused, the highest rate ever recorded. That translates to roughly $18 million in wasted spending per enterprise annually. Only 49% of SaaS users logged in within the past 30 days, while 23% of licenses showed zero usage over 90 days. Collaboration tools had the highest waste rate at 58%, followed by analytics at 54%.
| Category | Waste Rate |
|---|---|
| Collaboration Tools | 58% |
| Analytics | 54% |
| HR Tools | 48% |
| CRM | 44% |
AI Integration in the SaaS Industry
AI is reshaping SaaS products and pricing. By 2026, more than 80% of companies are expected to have deployed AI-enabled apps in their IT environments. That figure was just 5% in 2023. Around 95% of organizations are projected to use AI-powered SaaS applications, with 51% of companies already using generative AI and 42% using natural language processing tools.
The global AI SaaS market is projected to grow at a CAGR exceeding 37% from 2023 to 2030. By 2031, the AI-created SaaS market could reach $770.32 billion, growing at a 40.2% annual rate. High-performing AI-native SaaS companies are hitting roughly $40 million in annual recurring revenue within their first year and exceeding $120 million by year two. Traditional SaaS companies historically needed five to seven years to reach comparable levels.
SaaS vendors are increasingly bundling AI features into core plans rather than selling them as optional add-ons. Gartner predicts that by 2027, 70% of top SaaS vendors will offer consumption-based pricing for at least part of their portfolio.
Top SaaS Companies and Revenue in 2026
Microsoft continues to lead the enterprise SaaS market through its commercial cloud business, which generates hundreds of billions in annual revenue. Salesforce reported that subscription and support revenue accounted for more than 93% of total company revenue, reflecting its pure SaaS model.
Oracle reported $53 billion in total revenue for fiscal year 2025, with cloud services and license support making up over 77% of that total. Oracle’s cloud infrastructure and application revenue grew 25% year over year. SAP posted cloud revenue of roughly $29 billion (annualized from first nine months of 2025), with 23% year-over-year growth. IBM generated more than $24 billion in hybrid cloud revenue, with its software segment growing 6% year over year.
| Company | Key Metric (FY 2025) |
|---|---|
| Oracle | $53B total revenue (77% cloud/license support) |
| SAP | ~$29B cloud revenue (23% YoY growth) |
| IBM | $24B+ hybrid cloud revenue |
| Salesforce | 93%+ revenue from subscriptions |
The top 10 SaaS vendors account for about 35% of total market revenue. The remaining 65% is spread across a long tail of smaller, specialized providers. Vertical SaaS (industry-specific software) is the fastest-growing segment at 24% year-over-year growth, compared to 16% for horizontal SaaS.
SaaS Industry Growth Statistics: Pricing and Sales Trends
Pricing models are shifting. Usage-based and consumption-based pricing are gaining traction as companies move away from flat per-seat models. Gartner forecasts that by 2027, 70% of leading SaaS vendors will offer consumption-based pricing for at least part of their offerings.
Sales cycles have lengthened. The average B2B SaaS sales cycle runs 134 days (about 4.4 months), up from 107 days in early 2022. Customer acquisition cost (CAC) has surged by 180%, and the CAC payback period has stretched by 150%. Among private SaaS companies, the median growth rate as of late 2024 was 30% for equity-backed firms and 25% for bootstrapped companies. SaaS companies with annual recurring revenue under $1 million reported the highest median growth at 50%.
About 41% of SaaS companies offer a free plan. Another 15% offer both free plans and free trials of premium tiers. The average SaaS business loses 18% of its average contract value to discounting.
SaaS Industry Growth Statistics: Investment and M&A Activity
SaaS companies accounted for more than 2,600 M&A transactions globally in 2025. Buyers prioritized scale, vertical specialization, and AI capabilities. Enterprise SaaS private equity investments hit $1.38 billion in the first seven months of 2025, up from $833 million for all of 2024.
Roughly 47% of venture capital investment went to SaaS startups in 2023. India’s SaaS ecosystem has produced about 250 companies with $10 million or more in annual recurring revenue, 36 of which have passed $100 million. SaaS gross margins among Indian providers typically range between 70% and 85%.
FAQ
How big is the global SaaS market in 2026?
The global SaaS market is projected to reach $375.57 billion in 2026, growing from $315.68 billion in 2025, according to Fortune Business Insights.
How many SaaS companies exist worldwide?
There are over 30,800 SaaS companies globally. Approximately 17,000 of them are based in the United States.
What is the average number of SaaS apps per enterprise in 2026?
The average enterprise manages 291 SaaS applications in 2026. Large enterprises with 10,000+ employees average 473 applications.
How fast is the AI SaaS market growing?
The global AI SaaS market is growing at a CAGR exceeding 37% from 2023 to 2030, with the market projected to reach $770.32 billion by 2031.
What percentage of SaaS licenses go unused?
About 51% of enterprise SaaS licenses go unused, costing the average enterprise roughly $18 million per year in wasted spending.