


Global travel and tourism generated $10.9 trillion in GDP in 2024, accounting for roughly one in every ten dollars produced worldwide. International arrivals hit 1.4 billion, business travel spending reached a new nominal record of $1.47 trillion, and the airline industry carried 5 billion passengers for the first time. Here are the most current travel business statistics heading into 2026, broken down by sector.
Travel Business Statistics: Key Numbers
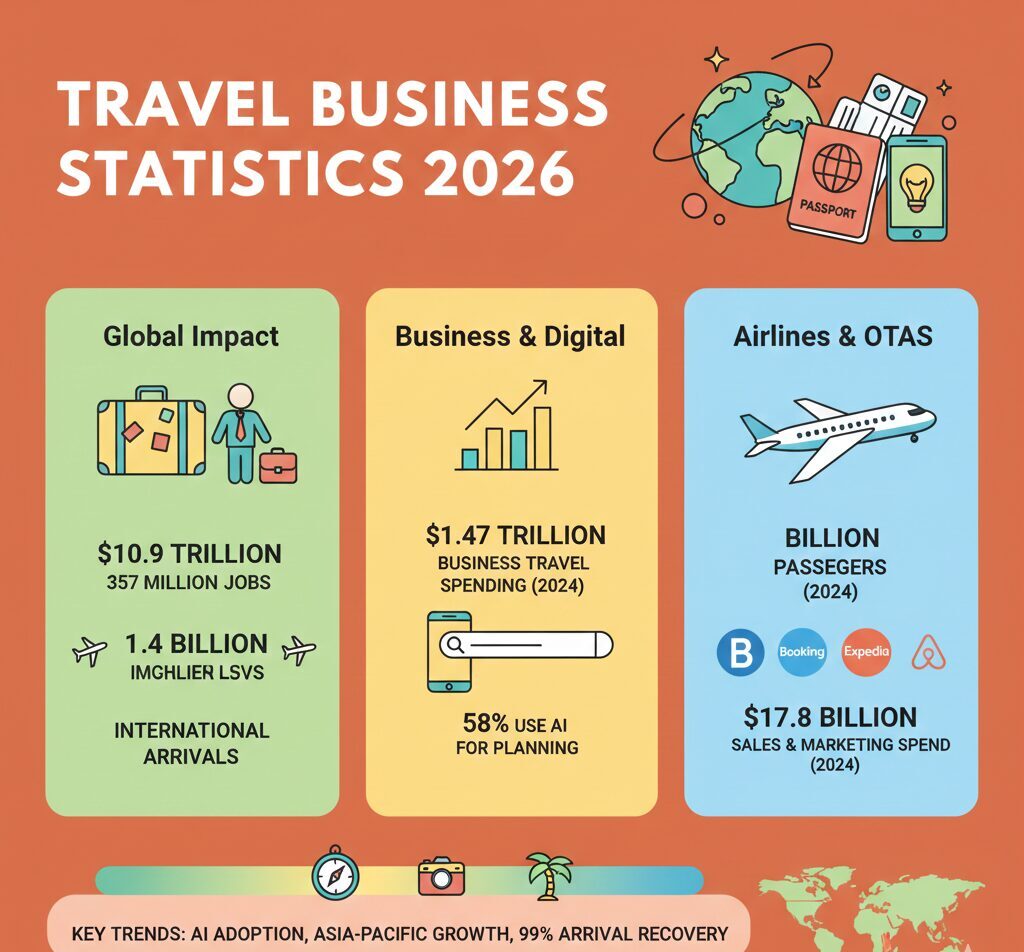
- Travel and tourism contributed $10.9 trillion to global GDP in 2024, or about 10% of the world total.
- The sector supported 357 million jobs worldwide as of 2024.
- Global business travel spending reached $1.47 trillion in 2024, an 11.1% year-over-year increase.
- International tourist arrivals totaled 1.4 billion in 2024, recovering to 99% of 2019 levels.
- Airlines carried 5 billion passengers in 2024, with net profit of $31.5 billion industry-wide.
Travel Business GDP and Employment
The travel sector’s GDP contribution passed its pre-pandemic peak in 2024. The WTTC projects $16.5 trillion in annual output and over 460 million jobs by 2035, with most new positions concentrated in Asia-Pacific.
The U.S. led all countries with a $2.6 trillion contribution, followed by China. International visitor spending grew nearly 12% year-over-year to $1.87 trillion, while domestic spending rose 5.4% to $5.3 trillion.
Global Business Travel Spending Statistics
Business travel spending hit $1.47 trillion in 2024, a new nominal record. GBTA projects $1.69 trillion by 2026. On an inflation-adjusted basis, though, 2024 spending still sat about 14% below 2019 levels, which means actual trip volume hasn’t caught up despite the record dollar figures.
The U.S. and China together account for about 58% of total global business travel spend, at $395.4 billion and $373.1 billion respectively. The average business trip cost $834 in 2024: $312 for lodging, $176 for airfare, $153 for food, $103 for ground transport, and $89 for other expenses.
Online Travel Agency Revenue Statistics
Booking Holdings dominated the OTA space in 2024 with $23.7 billion in revenue and $165.6 billion in gross bookings. Expedia followed at $13.69 billion, while Airbnb reported $11.1 billion. Combined, these three spent $17.8 billion on sales and marketing in a single year.
Booking processed 1.1 billion room nights (up 9%), and mobile bookings accounted for 60% of all transactions. Expedia’s B2B segment grew 24% in Q4 2024. Airbnb’s growth rate has cooled as Booking and Expedia compete more aggressively in short-term rentals.
Short-Term Rental Travel Business Market Share
The three largest platforms controlled 71% of the global short-term rental market in 2024, up from 53% in 2019. Airbnb nearly doubled its share from 28% to 44%. Booking.com moved from 14% to 18%. Vrbo actually lost ground, falling from 11% to 9%.
Independent property managers and smaller agencies saw the steepest drop, going from 47% to 29% of the market in five years.
International Tourism Arrivals Statistics
A total of 1.4 billion tourists crossed borders in 2024, reaching 99% of the 2019 benchmark. The Middle East was the top-performing region relative to pre-pandemic levels, with arrivals 32% above 2019. Africa also exceeded 2019 figures by 7%.
Total tourism export revenues, including passenger transport, reached a record $1.9 trillion. UN Tourism estimates 1.52 billion international arrivals for full-year 2025, an increase of roughly 60 million over 2024.
Airline Industry Travel Business Statistics
The global airline industry carried 5 billion passengers in 2024 and is expected to reach 5.2 billion in 2025. Total industry revenue is projected to cross $1 trillion for the first time.
The U.S. remained the largest single market at 876 million passengers. China ranked second with 741 million, growing 18.7% as it continued recovering from its delayed reopening. The busiest air route globally was Jeju–Seoul with 13.2 million passengers. Despite record volumes, airline profitability remains slim at a projected 3.6% net margin in 2025, or about $7 per passenger.
Online Travel Market Size and AI Adoption
The broader online travel market reached $685 billion in 2024 and is projected to hit $769 billion in 2025. SkyQuest Technology forecasts a compound annual growth rate of 12.3% through 2033, when the market could reach $1.95 trillion.
One notable shift: 58% of active travelers now use AI tools for trip planning, up threefold since 2023. Generative AI is influencing an estimated $350 billion in booking value through personalized suggestions. Zero-click searches in travel rose from 22.8% in mid-2024 to 26.7% by late 2025, putting pressure on brands to make content machine-readable rather than relying only on traditional SEO.
FAQ
How much did the travel industry contribute to global GDP in 2024?
Travel and tourism contributed $10.9 trillion to global GDP in 2024, equal to roughly 10% of total worldwide economic output, according to the WTTC.
How many international tourist arrivals were recorded in 2024?
There were 1.4 billion international tourist arrivals in 2024, recovering to 99% of 2019 levels. Europe accounted for the largest share at 747 million.
What is the projected global business travel spending for 2026?
GBTA projects global business travel spending will reach $1.69 trillion in 2026, an 8.1% increase over the estimated $1.57 trillion for 2025.
Which online travel agency had the highest revenue in 2024?
Booking Holdings reported the highest OTA revenue at $23.7 billion in 2024, with $165.6 billion in gross bookings and 1.1 billion room nights processed.
How many passengers did airlines carry globally in 2024?
Airlines carried 5 billion passengers worldwide in 2024 for the first time ever. The U.S. was the largest market with 876 million passengers, followed by China at 741 million.