

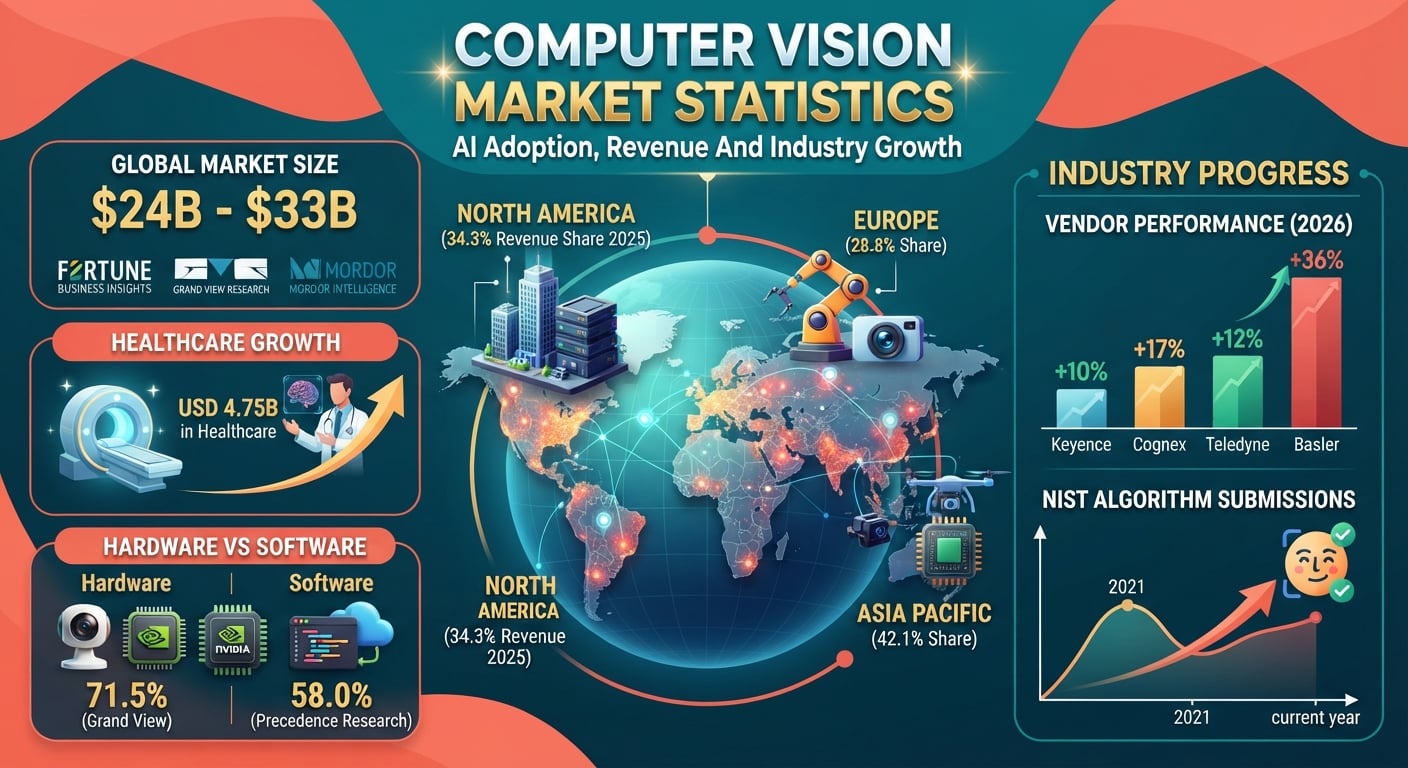
Five research firms price the computer vision market between USD 24.14 billion and USD 32.88 billion for 2026. They also disagree on which region leads and on whether hardware or software holds the revenue. Below are the 2026 figures, the regional splits, machine vision vendor results filed through August 2026, and NIST algorithm submission counts, each with its source and period.
Computer Vision Market Statistics
- Fortune Business Insights values the computer vision market at USD 24.14 billion in 2026.
- Grand View Research puts Asia Pacific at 42.1% of 2025 revenue; Fortune Business Insights puts it at 19.50%.
- Cognex recorded quarterly revenue of USD 291 million in Q2 2026, up 17% year over year.
- Precedence Research sizes computer vision in healthcare at USD 4.75 billion for 2026.
- NIST logged 99 face verification algorithms from 87 developers during 2026 through 1 September.
How Big Is The Computer Vision Market In 2026?
Three firms publish a 2026 computer vision market figure: USD 24.14 billion, USD 28.20 billion and USD 32.88 billion. Precedence Research measures a wider scope, AI in computer vision, and publishes a 2025 base rather than a 2026 one.
The forecast columns end in four different years, so the endpoints cannot be read side by side. The CAGRs are the comparable part, and they run from 14.80% to 30.58%.
| Research firm | 2025 size | 2026 size | Forecast | Forecast year | Stated CAGR |
|---|---|---|---|---|---|
| Fortune Business Insights | USD 20.75B | USD 24.14B | USD 72.80B | 2034 | 14.80% |
| Grand View Research | USD 23.60B | USD 28.20B | USD 101.50B | 2033 | 20.10% |
| Mordor Intelligence | USD 27.39B | USD 32.88B | USD 68.38B | 2031 | 15.77% |
| Precedence Research (AI in computer vision) | USD 30.22B | not published | USD 330.42B | 2034 | 30.58% |
Source: Fortune Business Insights, computer vision market report, updated August 2026; Grand View Research, computer vision market report, published July 2026; Mordor Intelligence, computer vision market report, 2026 edition; Precedence Research, AI in computer vision market report, updated June 2025. Each firm applies its own scope definition, so the rows measure vendor revenue under four different boundaries.
Which Region Leads The Computer Vision Market?
Fortune Business Insights ranks North America first at 34.30% of 2025 revenue and Asia Pacific third at 19.50%. Grand View Research reverses that, giving Asia Pacific 42.1% of 2025 revenue and naming China the largest single country market.
Mordor Intelligence places North America higher still, at 49.01% of 2025 revenue, and expects Asia-Pacific to post the fastest regional CAGR at 16.39% between 2026 and 2031. Hardware-weighted models push value toward Chinese camera and sensor output; software-weighted models book it where the platform vendor invoices. Sony’s image sensor business sits on one side of that line, while Microsoft and other cloud vision vendors sit on the other.
| Region | 2025 revenue | 2025 share | 2026 estimate |
|---|---|---|---|
| North America | USD 7.11B | 34.30% | USD 8.17B |
| Europe | USD 5.98B | 28.80% | USD 6.96B |
| Asia Pacific | USD 4.05B | 19.50% | USD 4.82B |
| Middle East & Africa | USD 1.89B | 9.10% | USD 2.21B |
| South America | USD 1.72B | 8.30% | USD 2.00B |
Source: Fortune Business Insights, computer vision market report, 2025 revenue and 2026 estimates, updated August 2026.
Computer Vision Market By Country
Fortune Business Insights projects the United States at USD 4.91 billion in 2026, ahead of Germany at USD 2.15 billion and the United Kingdom at USD 1.52 billion. China and Japan sit close together at USD 1.37 billion and USD 1.35 billion, with India at USD 0.70 billion.
Is Hardware Or Software The Bigger Computer Vision Market Segment?
The two answers are 14 months apart and point in opposite directions. Grand View Research has hardware at 71.5% of its 2025 market; Fortune Business Insights has software and services at 57.65% of its 2026 market.
The split turns on whether an embedded camera counts at full unit value or only at the licence fee for the software running on it. Chip suppliers such as NVIDIA and Intel fall inside the hardware line under one definition and outside it under another.
Fortune Business Insights lists Texas Instruments and Qualcomm Technologies among the 19 companies it studies, which shows how far the vendor boundary stretches past cameras and lenses.
| Research firm | Segment | Share | Period |
|---|---|---|---|
| Grand View Research | Hardware | 71.50% | 2025 |
| Fortune Business Insights | Software & services | 57.65% | 2026 |
| Precedence Research (AI in computer vision) | Software | 58.00% | 2024 |
Source: Grand View Research, published July 2026; Fortune Business Insights, updated August 2026; Precedence Research, updated June 2025. Each share is of that firm’s own total market, measured under its own scope definition, so the three rows are not shares of one market.
Grand View Research splits its market further for 2025: smart camera-based systems hold 56.5%, non-industrial verticals hold 52.3%, and quality assurance and inspection is the largest application at 26.1%.
What Are Computer Vision Vendors Reporting In 2026?
Reported vendor revenue ran ahead of the slower market forecasts in the most recent periods. Of the four companies below, Basler reported the largest percentage gain, measured against a first-half 2025 base of EUR 111.7 million.
Keyence reported the largest absolute revenue of the four and lifted operating profit 8.4% on a 10.4% sales gain. Industrial peers such as Omron report vision inside broader automation segments, which is part of why clean market totals are hard to assemble.
| Company | Period | Revenue | Change | Profitability |
|---|---|---|---|---|
| Keyence | FY ended 31 Mar 2026 | JPY 1,169,289M | +10.4% | Operating profit JPY 595,759M, +8.4% |
| Teledyne Digital Imaging | Q2 2026, ended 28 Jun 2026 | USD 868.7M | +12.7% | Operating income USD 170.2M, +42.3% |
| Cognex | Q2 2026, ended 5 Jul 2026 | USD 291M | +17% | Operating margin 29.4% |
| Basler AG | H1 2026, ended 30 Jun 2026 | EUR 152.4M | +36% | EBIT margin 20.4% |
Source: company financial reports — Keyence (FY March 2026 results, 24 April 2026), Teledyne Technologies (Q2 2026 earnings release, 22 July 2026), Cognex (Q2 2026 earnings release, 5 August 2026), Basler AG (H1 2026 ad-hoc release, 4 August 2026). Each row is that company’s own reported revenue for the stated period, in its reporting currency.
The turn is recent. Teledyne’s Digital Imaging segment grew 3.0% in fiscal 2025 to USD 3,163.9 million, then 12.7% in the second quarter of 2026. Basler, citing VDMA figures, reported that order intake for German image processing component manufacturers was 25% higher in nominal terms at the end of June 2026 than a year earlier, with industry revenue up 9%.
Cognex raised full-year 2026 guidance to revenue of USD 1.13 billion to USD 1.15 billion. Basler raised its 2026 forecast twice, most recently to EUR 270 million to EUR 290 million with an EBIT margin of 12.5% to 14.5%, while flagging supply disruption after an earthquake halted image sensor production at a supplier plant in Kumamoto.
Computer Vision Market In Healthcare
Precedence Research forecasts healthcare computer vision at a 34.26% CAGR from 2026 to 2035, its own stated rate for that segment. North America held 37% of the 2025 healthcare total.
The awkward part is cross-firm. USD 4.75 billion in healthcare alone equals a fifth of Fortune Business Insights’ entire computer vision market for 2026, which is a reminder that the two totals are not drawn from a shared base.
| Metric | Value | Period |
|---|---|---|
| Global market size | USD 3.51B | 2025 |
| Global market size | USD 4.75B | 2026 |
| Global forecast | USD 66.81B | 2035 |
| Stated CAGR | 34.26% | 2026–2035 |
| North America share | 37.00% | 2025 |
| U.S. market size | USD 970M | 2025 |
| U.S. forecast | USD 18,940M | 2035 |
Source: Precedence Research, computer vision in healthcare market report, updated 9 September 2026.
How Many Face Recognition Algorithms Reach NIST Each Year?
NIST has evaluated 1,462 face verification algorithms from 447 unique developers since its ongoing FRTE 1:1 track opened in 2017. Submissions peaked at 224 algorithms in 2021 and fell to 123 in 2025.
The 2026 count stands at 99 algorithms from 87 developers as of 1 September, a partial year. Developer counts are unique within each year and cannot be added across years. The narrowing gap between algorithm and developer counts means more of the recent supply comes from first-time entrants submitting a single model, a pattern also visible in the vendor concentration data behind these AI market share statistics.
Source: NIST, Face Recognition Technology Evaluation (FRTE) 1:1 Verification participation statistics, 2017 to 2026, last updated 1 September 2026. The 2026 column covers a partial year.
FAQs
How big is the computer vision market in 2026?
Published 2026 estimates range from USD 24.14 billion (Fortune Business Insights) to USD 32.88 billion (Mordor Intelligence), with Grand View Research at USD 28.20 billion. The spread reflects different scope definitions, not different years.
Which region has the largest computer vision market share?
It depends on the firm. North America holds 34.30% of 2025 revenue for Fortune Business Insights and 49.01% for Mordor Intelligence. Grand View Research instead puts Asia Pacific first, at 42.1% of 2025 revenue.
Is hardware or software the larger computer vision segment?
Grand View Research puts hardware at 71.5% of 2025 revenue. Fortune Business Insights puts software and services at 57.65% for 2026. The two count embedded imaging hardware differently, so neither figure travels outside its own report.
Are the computer vision market figures posted on Reddit accurate?
Numbers shared on Reddit usually trace to one research firm with its scope note stripped out. Published 2026 estimates run from USD 24.14 billion to USD 32.88 billion, so check which report a figure came from before using it.
How fast is computer vision growing in healthcare?
Precedence Research puts the healthcare segment at USD 4.75 billion in 2026 and forecasts USD 66.81 billion by 2035, a stated CAGR of 34.26% from 2026 to 2035. North America held 37% of the 2025 total.
Sources
https://www.fortunebusinessinsights.com/computer-vision-market-108827
https://www.precedenceresearch.com/computer-vision-in-healthcare-market
https://pages.nist.gov/frvt/html/frvt11.html
https://www.teledyne.com/en-us/investors/Documents/2026q2-teledyne-earnings-release.pdf
