

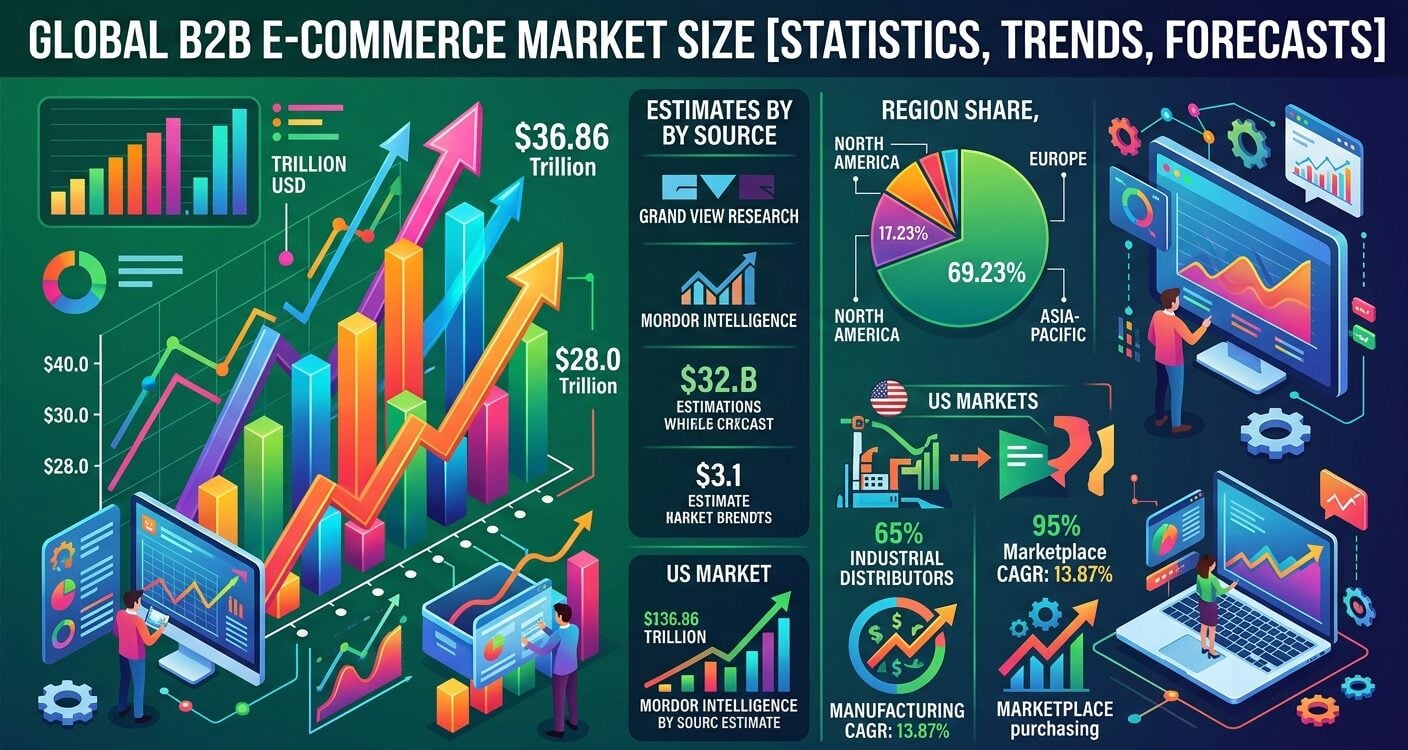
Global B2B e-commerce market size estimates for 2026 range from $28.0 trillion at Grand View Research to $36.86 trillion in gross merchandise value at Mordor Intelligence. Each firm applies its own market definition, so the two figures are not interchangeable.
This brief covers both forecasts, regional and segment splits, 2025 US sales, McKinsey’s 2026 buyer survey and the latest platform disclosures.
B2B E-Commerce Market Size Statistics 2026
How Big Is the B2B E-Commerce Market in 2026?
Three published estimates frame 2026: $36.86 trillion from Mordor Intelligence, $36 trillion from the International Trade Administration (ITA) and $28.0 trillion from Grand View Research.
Base years, growth rates and scope differ between them. Read each figure against its own series.
Mordor Intelligence: $36.86 Trillion in 2026 GMV
Mordor’s gross merchandise value series rises from $33.02 trillion in 2025 to $36.86 trillion in 2026. It reaches $61.66 trillion by 2031, a 10.84% CAGR over 2026–2031.
Source: Mordor Intelligence, B2B E-commerce Market Report 2026–2031, data as of January 2026
Grand View Research: $28.0 Trillion in 2026
| Year | Market size (USD) | Status in report |
|---|---|---|
| 2025 | $24.1 trillion | Valued |
| 2026 | $28.0 trillion | Estimated |
| 2033 | $105.9 trillion | Projected |
Source: Grand View Research, Business-to-Business E-commerce Market Report, 2026–2033 edition
Grand View projects a 20.9% CAGR from 2026 to 2033.
The ITA’s eCommerce Sales & Size Forecast values the global B2B e-commerce market at $36 trillion by 2026. Its forecast uses a 14.5% CAGR through 2026.
Source: International Trade Administration, eCommerce Sales & Size Forecast, 2024 edition
B2B E-Commerce Market Size by Region: Asia-Pacific at 69.23%
69.23%
Asia-Pacific share of global B2B e-commerce revenue, 2025
Asia-Pacific produced 69.23% of global B2B e-commerce revenue in 2025, according to Mordor Intelligence.
Source: Mordor Intelligence, B2B E-commerce Market Report 2026–2031, 2025 regional shares
Other estimates of the region’s share sit far apart. Grand View Research puts Asia Pacific at 39.5% of 2025 revenue, while the ITA forecasts 80% of B2B market share by 2026.
Source: Grand View Research, 2026–2033 edition (2025 share); International Trade Administration, 2024 forecast edition (2026 share)
North America is the fastest-growing region in both the Mordor and Grand View reports. Mordor projects a 12.09% CAGR through 2031 and ties it to enterprises adopting cloud-native platforms embedded within ERP suites.
Source: Mordor Intelligence, 2026–2031 forecast; Grand View Research, 2026–2033 forecast
Which B2B E-Commerce Segments Grow Fastest Through 2031?
Marketplace purchasing leads Mordor Intelligence’s published segment rates with a 13.87% CAGR through 2031. All four segment and regional rates shown below sit above the 10.84% rate Mordor projects for the total market.
Source: Mordor Intelligence, B2B E-commerce Market Report 2026–2031, data as of January 2026
The 2025 shares below come from three different cuts of the same report, so they do not add up to one total.
By channel, marketplace purchasing held 65.12% of the market. By transaction model, cross-border trade took 44.32% of volume, and by vertical, manufacturing captured 24.67% of revenue.
Source: Mordor Intelligence, B2B E-commerce Market Report 2026–2031, 2025 shares
US B2B E-Commerce Sales Reached $2.93 Trillion in 2025
US B2B e-commerce grew 13% to $2.93 trillion in 2025, based on Digital Commerce 360’s B2B Ecommerce Market Forecast Report.
Source: Digital Commerce 360, B2B Ecommerce Market Forecast Report, published February 2026
Total US manufacturing and wholesale distribution sales reached $15.12 trillion in 2025, up 0.4%. That figure covers all B2B channels, not e-commerce alone.
Source: Digital Commerce 360 analysis of US Department of Commerce data, 2025
Total US B2B Sales Growth, 2020–2025
Sales fell 2.6% in 2020, then rose 14.3% in 2021 and 14.5% in 2022. Annual growth has stayed at or below 1.0% since.
In dollar terms, sales went from $11.36 trillion in 2020 to $14.86 trillion in 2022. From 2022 through 2025, they rose 1.8% in total.
Source: Digital Commerce 360 analysis of US Department of Commerce data, 2020–2025
2025 Quarter by Quarter
| Quarter | Total US B2B sales, YoY change |
|---|---|
| Q1 2025 | +2.1% |
| Q2 2025 | −0.9% |
| Q3 2025 | +0.1% |
| Q4 2025 | +0.3% |
Source: Digital Commerce 360 analysis of US Department of Commerce data, Q1–Q4 2025
Industrial distributors and manufacturers described 2025 as marked by tariff-related price sensitivity, slower project starts and inventory normalization, Digital Commerce 360 reported.
Online Order Sizes in McKinsey’s 2026 B2B Pulse
McKinsey’s 2026 Global B2B Pulse Survey drew on close to 4,000 B2B decision-makers across 13 countries. Seventy-one percent of respondents said their organizations offer e-commerce.
Among those companies, about one-third of total revenue flows through digital channels, making it the top revenue-generating channel. Buyers use an average of ten channels along the purchase journey.
Source: McKinsey & Company, 2026 Global B2B Pulse Survey, published May 28, 2026
In 2026, 73% of respondents were comfortable placing orders above $50,000 online, up from 59% in 2022. Willingness to spend $500,000 or more online fell five percentage points from 2024.
Source: McKinsey & Company, Global B2B Pulse Survey, 2022, 2024 and 2026 editions
B2B Buyer Personas, 2026
Adapters, the relationship-oriented group, make up 53% of respondents, up from 44% in 2024. Seekers account for 29% and innovators for 18%.
Source: McKinsey & Company, 2026 Global B2B Pulse Survey
Who Will Spend $500,000+ Online?
Seekers show the highest willingness, at 61% for online purchases of $500,000 or more. The share is 29% among innovators and 18% among adapters.
Source: McKinsey & Company, 2026 Global B2B Pulse Survey
What Are Amazon Business, Grainger and IndiaMART Reporting in 2026?
Each company discloses a different metric, so the figures below should not be compared with one another.
Amazon Business reached $60 billion in annualized gross sales in Q2 2026, Amazon announced on July 21, 2026. The unit serves more than 11 million organizations across 11 countries, including 97 of the Fortune 100.
More than 1.8 million new organizations joined Amazon Business in the first half of 2026.
Source: Amazon press release, July 21, 2026 (Q2 2026 and H1 2026 data)
Grainger reported full-year 2025 sales of $17.9 billion, up 4.5%. Its 2026 guidance calls for net sales of $18.7 billion to $19.1 billion.
Source: Grainger fourth quarter and full year 2025 results, February 3, 2026
IndiaMART posted consolidated revenue from operations of ₹414 crore for the quarter ended June 30, 2026, up 11% year over year. The marketplace had 8.8 million supplier storefronts and 218,000 paying suppliers.
Unique business enquiries on IndiaMART totaled 26 million in the same quarter.
Source: IndiaMART InterMESH, Q1 FY2027 results press release, July 21, 2026
45% of B2B Buyers Used AI on a Recent Purchase
Gartner surveyed 646 B2B buyers from August through September 2025. Forty-five percent reported using AI during a recent purchase, and 67% said they prefer a rep-free experience.
Source: Gartner press release, March 9, 2026 (survey fielded August–September 2025)
On the seller side, 22% of organizations in McKinsey’s 2026 survey reported fully implemented gen AI capabilities, up from 19% a year earlier. Another 31% are in the process of adopting it.
Leading sellers merge customer relationship management, behavioral and transactional data into live customer profiles, McKinsey found. Sixty percent of market leaders, firms that grew market share by more than 10%, reported double-digit revenue growth in 2025, against 21% of laggards.
Source: McKinsey & Company, 2026 Global B2B Pulse Survey
Gartner predicts that by 2028, 90% of B2B buying will be AI agent intermediated, pushing over $15 trillion of B2B spend through AI agent exchanges. This is a forecast, not a measured result.
Source: Gartner, Top Strategic Predictions for 2026 and Beyond, October 21, 2025
FAQs
How big is the B2B e-commerce market in 2026?
Mordor Intelligence projects $36.86 trillion in gross merchandise value for 2026, up from $33.02 trillion in 2025. Grand View Research’s 2026 estimate is lower, at $28.0 trillion.
How fast is B2B e-commerce growing?
Forecast rates differ by firm: 10.84% a year for 2026–2031 at Mordor Intelligence, 20.9% for 2026–2033 at Grand View Research, and 14.5% through 2026 in the ITA forecast. US B2B e-commerce grew 13% in 2025.
What is the size of the US B2B e-commerce market?
US B2B e-commerce sales reached $2.93 trillion in 2025, up 13%, according to Digital Commerce 360. Total US manufacturing and wholesale distribution sales across all channels were $15.12 trillion, up 0.4%.
Which region dominates B2B e-commerce?
Asia-Pacific leads in all three estimates cited here: 69.23% of 2025 revenue per Mordor Intelligence, 39.5% per Grand View Research, and 80% by 2026 in the ITA forecast.
Why do B2B e-commerce market size numbers vary so much on Reddit and elsewhere?
Research firms define the market differently. For 2026, Grand View Research estimates $28.0 trillion, Mordor Intelligence $36.86 trillion in gross merchandise value, and the ITA $36 trillion. Compare growth rates only within one source.
