

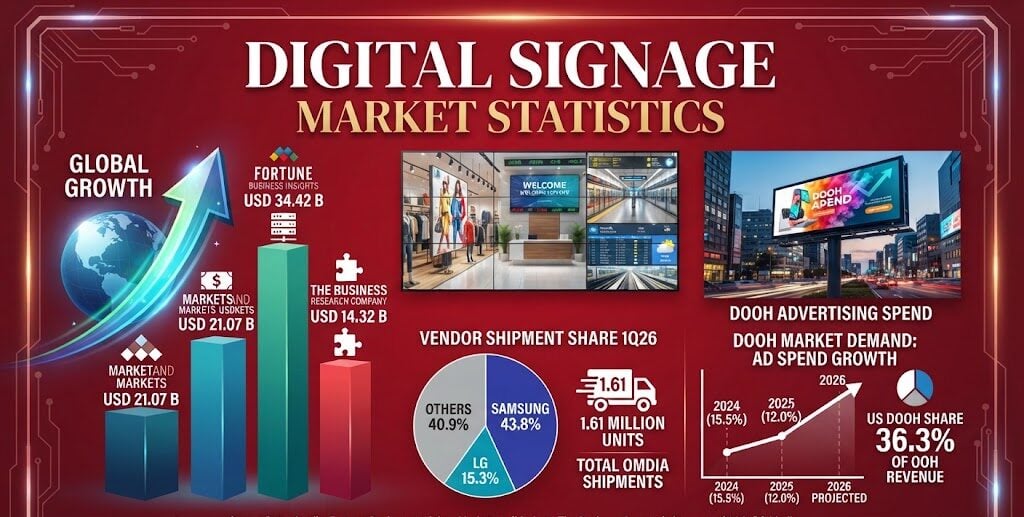
Two research firms priced the same 2026 digital signage market at USD 21.07 billion and USD 34.42 billion. The gap is scope, not disagreement.
This post collects verified 2025 and first-quarter 2026 figures on market size, panel shipments, vendor share, regional demand and out-of-home ad spending. Every number carries the organization that published it and the period it covers.
Digital Signage Market
How Big Is the Digital Signage Market in 2026?
Three firms published 2026 numbers using three different definitions of the same industry. They are not competing estimates of one quantity.
MarketsandMarkets prices a hardware-weighted basket of displays, media players, projectors and content management software. Fortune Business Insights adds content and services to hardware and software, which lifts its 2026 figure by more than a third.
The Business Research Company measures only the software layer, including content management, cloud services and technical support.
| Research firm | Published scope | 2026 value | Forecast |
|---|---|---|---|
| MarketsandMarkets | Hardware, media players, software | USD 21.07 B | USD 30.91 B by 2032, 6.6% CAGR |
| Fortune Business Insights | Hardware, software, content, services | USD 34.42 B | USD 69.90 B by 2034, 9.26% CAGR |
| The Business Research Company | Signage software only | USD 14.32 B | USD 22.76 B by 2030, 12.3% CAGR |
Source: MarketsandMarkets, Digital Signage Market, 2026 estimate; Fortune Business Insights, Digital Signage Market, updated August 2026; The Business Research Company, Digital Signage Software Market Report 2026. Vendor revenue, each under its own scope definition.
Fortune Business Insights put its 2025 base at USD 31.50 billion and reports North America as the leading region with a 42.06% revenue share that year.
Digital Signage Market Shipments: Omdia Q1 2026 Panel Data
Omdia’s Public Displays Market Tracker measures units shipped, not revenue or installed screens. Signage and information displays recorded a third consecutive quarterly rise in 1Q26.
Videowalls moved the other way. Omdia attributes the decline to corporate installations shifting from tiled LCD to direct-view LED.
| Display category | 1Q26 shipments | QoQ change | YoY change |
|---|---|---|---|
| Public display and signage TV | 1.61 million units | Down from 1.94 million in 4Q25 | Not published |
| Signage and information displays | Not published | +4.3% | +2.8% |
| Videowalls | Over 71,000 units | −15.7% | −19.2% |
| Interactive flat panel and touch | Not published | Nearly −10% | Not published |
Source: Omdia, Public Displays Market Tracker, 1Q26 (January–March 2026), units shipped. The interactive flat panel figure excludes an Indonesian education deployment of more than 280,000 units in 4Q25.
Four regions carried the signage and information display increase. Western Europe led on a quarterly basis.
Digital Signage Market Vendor Share
Samsung held 43.8% of signage and information display shipments in 1Q26 and LG Electronics held 15.3%, per Omdia. LG grew shipments 20.7% during the quarter against Samsung’s 2.9%, from a smaller base.
Samsung’s two published shares measure different baskets. The company reported a 35.2% share of the global commercial display market by unit sales for full-year 2025, its 17th consecutive year at number one, citing Omdia’s Q4 2025 Public Display Report, which excludes consumer TVs. That release also put annual shipments above 2.5 million units. Sharp and Sony, whose Sharp corporate background and Sony profiles both trace back to prewar Japan, posted the fastest quarterly gains of the named vendors.
| Vendor | 1Q26 share of shipments | QoQ shipment change |
|---|---|---|
| Samsung Electronics | 43.8% | +2.9% |
| LG Electronics | 15.3% | +20.7% |
| Sharp | Not published | +37.6% |
| Sony | Not published | +9.4% |
Source: Omdia, Public Displays Market Tracker, 1Q26, signage and information display shipments.
Omdia noted that most Chinese brands recorded double-digit declines in the quarter.
Neither Samsung Electronics nor Panasonic breaks out signage revenue as a separate reporting line, which is why unit shipment trackers carry the vendor picture.
Digital Signage Market Demand: DOOH Advertising Spend
Advertising money, not IT budget, funds most large screen networks. PQ Media measures global digital out-of-home spending across two platforms and reported both for 2025.
Digital place-based networks reached USD 18.20 billion, up 12.4%. Digital billboards and posters reached USD 9.28 billion, up 11.3%.
Overall global DOOH growth slowed to 12.0% in 2025 from 15.5% in 2024. PQ Media projects 15.3% growth for 2026 and attributes the acceleration to federal elections in 13 of the top 20 markets, the Winter Olympics in Italy and the FIFA World Cup.
In the United States, OAAA recorded total out-of-home revenue of USD 9.46 billion for 2025, a record, up 3.6% year over year across 19 consecutive quarters of growth.
Digital formats grew roughly three times faster than the category that contains them.
| Metric | 2025 figure | Year-over-year change |
|---|---|---|
| Total US OOH ad revenue | USD 9.46 B | +3.6% |
| DOOH share of US OOH revenue | 36.3% | +10.5% |
| Transit format revenue | Not published | +9.2% |
| Q4 2025 OOH revenue | Not published | +4.8% |
Source: Out of Home Advertising Association of America, 2025 OOH Facts and Figures, full-year 2025, released March 2026.
PQ Media and OAAA size the US market differently. PQ Media puts US out-of-home at USD 14.64 billion for 2025, ranking it second worldwide behind China at USD 16.65 billion. The two figures use separate methodologies and should not be compared directly.
Digital Signage Market by Region
Omdia’s LED Video Displays Market Tracker measures shipments in square meters. Global LED video display shipments rose 0.6% in 1Q26 while revenue fell 2.3% year over year, the first contraction since 2022.
Asia and Oceania recorded the strongest regional growth at 16.9% year over year, driven by India, Indonesia and Vietnam. North America delivered stable growth in shipments and revenue, supported by pre-World Cup arena upgrades. Western Europe declined slightly and the Middle East and Africa recorded modest declines in both measures.
The pixel pitch data shows where demand moved.
In the 0.60–0.99mm category, Leyard, Samsung and Unilumin held a combined 48.5% shipment share. Absen, Unilumin and Daktronics held approximately 40% of shipments in the 5.00–9.99mm category.
Australia leads DOOH’s share of total out-of-home spending at 60.6% in 2025, one of four countries above 50%, according to PQ Media.
Digital Signage Market Software Outlook
Software compounds faster than any full-market estimate. The Business Research Company puts the signage software market at USD 14.32 billion in 2026, up from USD 12.76 billion in 2025.
Its forecast runs to USD 22.76 billion by 2030 at a 12.3% CAGR, with North America the largest region in 2025. The scope covers content management systems, cloud services, hardware integration and technical support.
Fortune Business Insights reports the same directional shift, describing procurement moving from hardware-only refresh cycles toward recurring software and managed services. Retail media is part of that case, with retailers such as Walmart treating in-store screens as advertising inventory. Samsung has also announced Cisco-certified wide-format display collaborations, extending signage into Cisco Systems meeting rooms.
Digital Signage Market Results: Daktronics Fiscal 2026
Daktronics is the clearest public read on outdoor and large-format demand. Its fiscal 2026 ended May 2, 2026, and ran 53 weeks against 52 weeks in fiscal 2025.
| Metric | Fiscal 2026 | Change vs fiscal 2025 |
|---|---|---|
| Net sales | USD 838.7 M | +10.9% |
| New orders | USD 860.8 M | +10.2% |
| Product backlog at year end | USD 356.2 M | +4.3% |
| Operating margin | 7.3% | 4.4% in fiscal 2025 |
| Earnings per share | USD 0.92 | Loss of USD 0.21 in fiscal 2025 |
Source: Daktronics, fourth quarter and full fiscal year 2026 results, fiscal year ended May 2, 2026.
Orders exceeded revenue throughout the year. Fourth-quarter orders fell 7.7% against a fiscal 2025 quarter the company describes as exceptionally strong, when buyers ordered ahead of price increases.
Omdia flagged a cost pressure running the other way. Display manufacturers face higher component costs as AI data center demand competes for memory chips, and LED video display vendors began implementing price increases in April 2026.
FAQs
How big is the digital signage market in 2026?
Estimates range from USD 21.07 billion to USD 34.42 billion for 2026. MarketsandMarkets prices a hardware-weighted scope; Fortune Business Insights includes content and services. The Business Research Company sizes software alone at USD 14.32 billion.
Who leads the digital signage market?
Samsung held 43.8% of global signage and information display shipments in the first quarter of 2026, followed by LG Electronics at 15.3%, according to Omdia. Samsung reported 35.2% of commercial display unit sales for full-year 2025.
Are digital signage shipments growing?
Signage and information display shipments rose 4.3% quarter over quarter and 2.8% year over year in 1Q26, a third consecutive quarterly gain. Videowall shipments fell 19.2% year over year over the same period.
How fast is DOOH advertising growing?
Global digital out-of-home ad spending grew 12.0% in 2025, down from 15.5% in 2024, with 15.3% projected for 2026 by PQ Media. In the US, DOOH reached 36.3% of out-of-home revenue.
What does Reddit say about digital signage software costs?
Reddit threads on signage software pricing are anecdotal and carry no measured sample, so they are not a dataset. The published figure is The Business Research Company’s USD 14.32 billion software market for 2026.
