

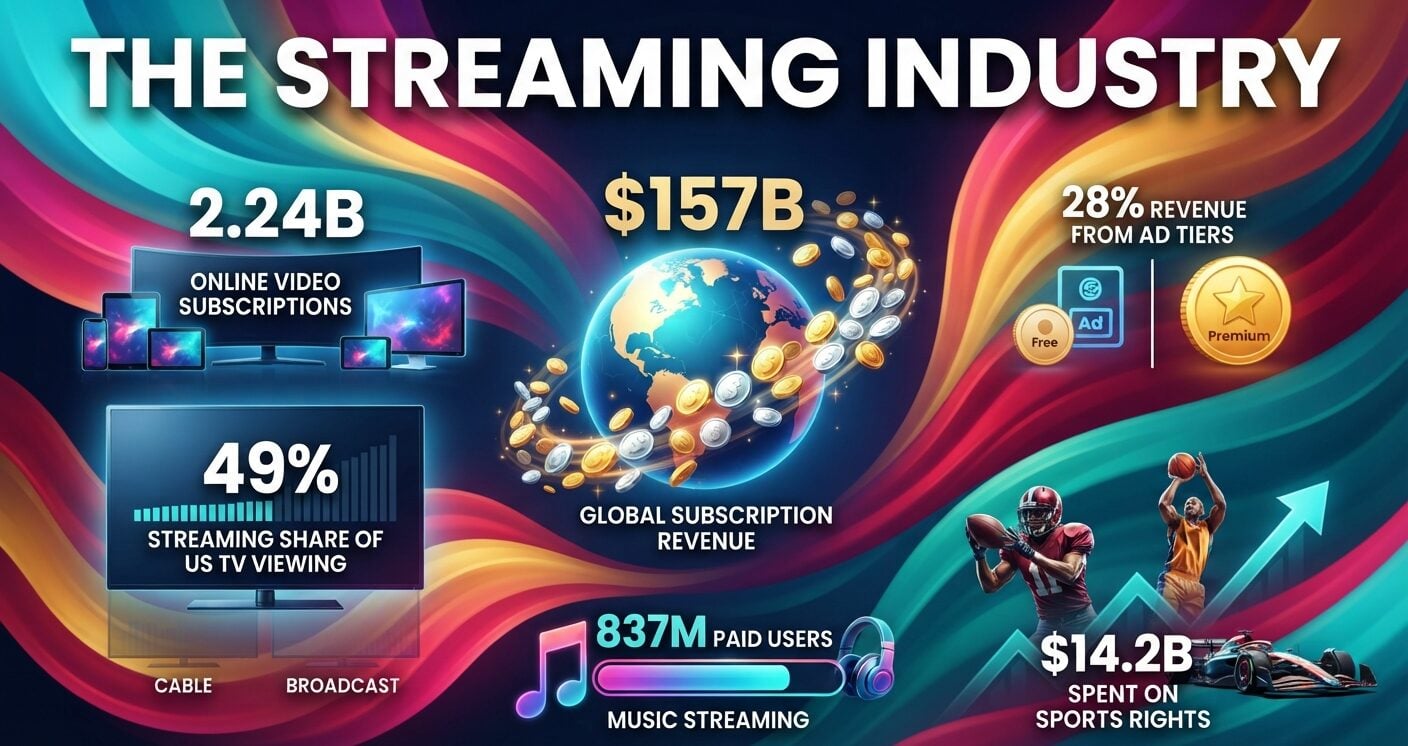
Global streaming subscription revenue reached $157.1 billion in 2025, according to Ampere Analysis. Omdia counted 2.24 billion online video subscriptions worldwide at the end of that year.
These streaming industry statistics cover revenue, subscriptions, US TV viewing share, ad tiers, company results, music, sports rights and household churn. Each figure carries its source and period.
Streaming Industry Statistics
How Big Is the Streaming Industry by Revenue?
Global streaming subscription revenue grew 14% to $157.1 billion in 2025. The total has tripled since 2020, when it first passed $50 billion.
The US generated 50% of that revenue. Ampere named Netflix the largest contributor in the US market, ahead of its streaming competitors.
Counting advertising as well, streaming services brought in $177 billion in 2025. Ampere projects subscription revenue will rise another 29% over five years and pass $200 billion by 2030.
Source: Ampere Analysis, global streaming revenue research, March 2026 (2025 data)
Online Video Revenue vs Pay-TV Revenue
| Segment | 2025 revenue | Change vs 2024 |
|---|---|---|
| Online video | $176 billion | +13.5% |
| Pay TV | $170 billion | −4% |
Omdia measures a different scope from Ampere: subscription and transactional revenue, with advertising excluded. On that basis, online video overtook pay TV for the first time in 2025.
Source: Omdia, TV & Video market data release, June 2026 (2025 data)
2.24 Billion Online Video Subscriptions Worldwide
| Subscription type | Subscriptions, end of 2025 | Year-over-year change |
|---|---|---|
| Online video | 2.24 billion | +17.6% |
| Pay TV | 1.03 billion | −1.8% |
Source: Omdia, TV & Video market data release, June 2026 (2025 data)
Online video held 68.4% of the combined 3.3 billion subscriptions. These are subscription counts, not people; one household can pay for several services.
Omdia called the 17.6% increase the largest annual rise since 2021. Its analysts said low-priced ad tiers created a temporary uplift, and the firm forecasts growth of 5.6% for 2026.
Source: Omdia, June 2026 release (2025 data; 2026 forecast)
Streaming Industry Share of US TV Viewing in July 2026
Streaming took 49.0% of US TV viewing in Nielsen’s July 2026 report, up from 48.5% in June and 48.6% in May. Broadcast finished July at 19.5% and cable at 18.7%.
The July interval ran from June 29 to July 26, 2026. Total TV usage rose 2.2% from June as FIFA World Cup coverage continued.
Source: Nielsen, The Gauge, May, June and July 2026 reports
Media Distributors Ranked by Share of TV
| Media distributor | Share of US TV viewing, July 2026 |
|---|---|
| YouTube | 14.2% |
| NBCU-Versant | 9.2% |
| FOX | 7.8% |
Source: Nielsen, Media Distributor Gauge, July 2026
Nielsen described YouTube’s 14.2% as a record, giving the Google-owned video platform a 5.0-point lead over No. 2 NBCU-Versant.
Among individual streaming platforms, Disney’s streaming properties took 4.7% of TV in July and Peacock took 2.6%. Nielsen will apply methodology updates to The Gauge this fall.
Source: Nielsen, The Gauge, July 2026
What Share of Streaming Revenue Comes From Ad Tiers?
Ad-supported tiers generated 28% of global streaming subscription revenue in 2025, up from less than 5% in 2020.
Source: Ampere Analysis, March 2026 (2020 and 2025 data)
In the US, 68% of SVOD subscribers now have at least one ad-supported tier. Deloitte based that on a survey of 3,575 US consumers fielded in late 2025.
Source: Deloitte, 2026 Digital Media Trends, March 2026
Streaming captured 46.6% of US ad-supported TV viewing in Q1 2026, which Nielsen called a record high driven by events including the Super Bowl and Winter Olympics. Ad-supported TV made up nearly 73% of all TV viewing.
Source: Nielsen, Ad Supported Gauge, Q1 2026
Netflix ad revenue rose more than 2.5 times to over $1.5 billion in 2025. The company expects it to roughly double in 2026.
Source: Netflix, Q4 2025 shareholder letter, January 20, 2026
$12.6 Billion Quarter: Netflix Guidance and Peacock’s First Profit
Netflix
For 2025, Netflix reported $45.2 billion in revenue, up 16%, and a 29.5% operating margin. It crossed 325 million paid memberships in Q4 2025.
Source: Netflix, Q4 2025 shareholder letter, January 20, 2026
| Metric (in thousands) | Q2 2026 | Q2 2025 | Change |
|---|---|---|---|
| Revenues | $12,559,938 | $11,079,166 | 13% |
| Operating income | $4,192,610 | $3,774,694 | 11% |
| Net income | $3,401,414 | $3,125,413 | 9% |
Source: Netflix, Form 10-Q, quarter ended June 30, 2026
Operating margin came in at 33.4% for Q2 2026, against 34.1% a year earlier. Netflix attributed the dip to technology, development and marketing costs growing faster than revenue.
In July 2026 Netflix narrowed its full-year revenue forecast to $51.0–$51.4 billion, from $50.7–$51.7 billion in January. The 31.5% operating margin target did not change.
Source: Netflix, shareholder letters dated January 20 and July 16, 2026
Peacock
Peacock reported adjusted EBITDA of $189 million in Q2 2026, up $290 million year over year. Comcast said the quarter marked Peacock’s first quarterly profit.
Paid subscribers reached 48 million on June 30, 2026, against 41 million a year earlier. Peacock-related revenue was $1.9 billion in the quarter, up from $1.2 billion.
Source: Comcast, Form 10-Q and Q2 2026 earnings release, quarter ended June 30, 2026
Music Streaming Industry Statistics From IFPI and Spotify
Global recorded music revenues grew 6.4% to $31.7 billion in 2025, IFPI’s eleventh straight year of growth. Total streaming revenue passed $22 billion, or 69.6% of the total.
Paid subscription streaming grew 8.8% and accounted for 52.4% of global revenue. IFPI counted 837 million users of paid streaming subscription accounts.
Source: IFPI, Global Music Report 2026, March 2026 (2025 data)
Every region grew. Latin America led at 17.1%, while USA and Canada, the largest region, grew 3.5% and held 38.7% of global revenue.
Source: IFPI, Global Music Report 2026 (2025 data)
Spotify Premium Subscribers
Spotify reached 300 million Premium subscribers in Q2 2026, up 9% year over year. Monthly active users grew 12% to 777 million.
Revenue rose 14% to €4,777 million. Gross margin hit 33.4%, which Spotify called an all-time high.
Source: Spotify, Q2 2026 shareholder update (Form 6-K), August 4, 2026
Who Spends the Most on Streaming Sports Rights?
Streaming services will spend $14.2 billion on sports rights in 2026, up 7% from $13.2 billion in 2025. Ampere based the projection on deals agreed to date.
Amazon Prime Video leads with $3.8 billion, or 27% of the total. DAZN, the top spender every year since 2018, drops to second at 22%.
The year 2026 is the first full year of Amazon’s 11-year NBA deal, worth $1.8 billion per season. Paramount+ entered the top five on a $1.1 billion-a-year UFC contract.
Generalist streamers such as Prime Video, Netflix, Paramount+, Disney+ and Apple TV will account for 44% of streamer sports spending, up from 31% in 2025.
Source: Ampere Analysis, streaming sports rights forecast, February 2026
US Household Spending and Churn in Deloitte’s 2026 Survey
The average US subscribing household spends $69 a month on streaming, unchanged from the prior year. Deloitte found 90% of US households pay for at least one SVOD service, averaging four services.
| Consumer response | Share of US consumers surveyed |
|---|---|
| Cancelled an SVOD service in the last six months | 41% |
| Cancelled and returned to the same service in the last six months | 22% |
| Would cancel a favorite service if its price rose $5 a month | 61% |
| Frustrated that subscribed services keep raising prices | 73% |
Source: Deloitte, 2026 Digital Media Trends, survey fielded late 2025, published March 2026
Respondents could fall into more than one row, so these shares overlap and do not add up to a total.
FAQs
How big is the streaming industry?
Global streaming subscription revenue reached $157.1 billion in 2025, up 14%, according to Ampere Analysis. Including advertising, streaming services generated $177 billion that year.
What percentage of TV viewing is streaming?
Streaming accounted for 49.0% of US TV viewing in July 2026, based on Nielsen’s Gauge. Broadcast held 19.5% and cable 18.7% in the same month.
How many streaming subscriptions are there worldwide?
Omdia counted 2.24 billion online video subscriptions at the end of 2025, up 17.6% from 1.9 billion in 2024. That figure counts subscriptions, not individual people.
What is the most-watched streaming platform in the US?
YouTube took 14.2% of all US TV viewing in July 2026, per Nielsen, which called it a record. It led No. 2 media distributor NBCU-Versant by 5.0 share points.
Are Reddit complaints about streaming price hikes backed by data?
Survey data points the same way. Deloitte’s 2026 Digital Media Trends found 73% of US consumers frustrated by repeated price rises, and 61% would cancel a favorite service over a $5 monthly increase.
