

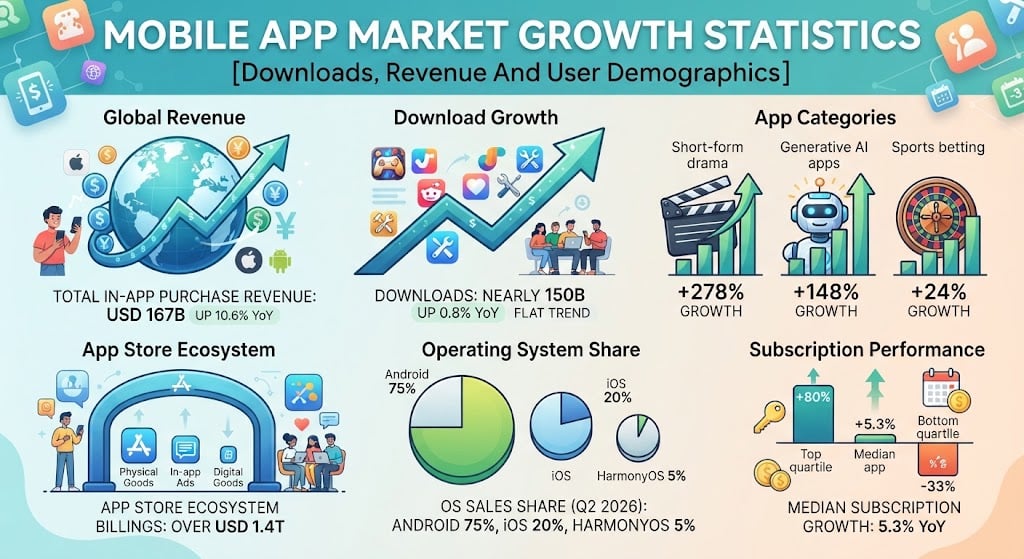
Global in-app purchase revenue reached USD 167 billion across iOS and Google Play in 2025, up 10.6% year over year, while downloads rose 0.8%. That split defines the current cycle. This post covers revenue, categories, storefronts, operating systems and subscription performance, using published 2025 and 2026 figures from Sensor Tower, Apple, Counterpoint Research and RevenueCat.
Mobile App Market Growth
How Big Was Mobile App Market Growth in 2025?
Sensor Tower’s State of Mobile 2026 report puts 2025 in-app purchase revenue at USD 167 billion across iOS and Google Play, a 10.6% rise. That figure counts paid downloads, in-app purchases and subscriptions, and excludes advertising.
Downloads reached nearly 150 billion, up 0.8%. Time spent hit 5.3 trillion hours, up 3.8%, or roughly 3.6 hours per day per mobile user.
| In-app purchase revenue, 2025 | Amount | YoY change |
|---|---|---|
| Total (iOS + Google Play) | USD 167B | +10.6% |
| Non-game apps | Approx. USD 85B | +21% |
| Games | Approaching USD 82B | +1.3% |
Source: Sensor Tower, State of Mobile 2026, full-year 2025
Non-Game Apps Passed Games
2025 was the first year non-game in-app purchase revenue exceeded games, on Sensor Tower’s measure. Non-game spending reached nearly three times its level five years earlier.
Which Categories Led Mobile App Market Growth?
Generative AI apps moved fastest. In-app purchase revenue nearly tripled to top USD 5 billion, and downloads doubled to 3.8 billion, per Sensor Tower.
Time spent in generative AI apps reached 48 billion hours in 2025, about 3.6 times the 2024 total and nearly ten times 2023. Sessions passed one trillion. Sensor Tower names Google, Microsoft and X among the big tech firms investing heavily in AI assistants.
ChatGPT ranked as the third highest-grossing app of 2025, behind TikTok and Google One, according to Sensor Tower CEO Oliver Yeh.
| Category | Download growth, 2025 (YoY) |
|---|---|
| Short-form drama | +278% |
| AI apps | +148% |
| Sports betting | +24% |
| Credit and lending | +18% |
| Restaurant and food delivery | +14% |
Source: Sensor Tower, State of Mobile 2026, full-year 2025
Not every category rose. Global retail app downloads and time spent both fell in 2025, which Sensor Tower attributes in part to slower expansion by Temu and SHEIN.
Retailers tested AI shopping tools during the same period, including Amazon‘s Rufus and Walmart‘s Sparky. Social media stayed the largest block of attention, at nearly 2.5 trillion combined hours.
Mobile App Market Growth Across the App Store Ecosystem
Apple reported that its App Store ecosystem facilitated over USD 1.4 trillion in developer billings and sales in 2025, citing a study by economists at Analysis Group. This measures commerce flowing through apps, not App Store commission revenue, and is not comparable with Sensor Tower’s in-app purchase total.
Apple states developers paid no commission on more than 90% of those billings and sales. The store recorded over 850 million average weekly users spanning 175 countries and regions.
| Developer billings and sales, 2025 | Amount |
|---|---|
| Physical goods and services | USD 1.1 trillion |
| In-app advertising | USD 151 billion |
| Digital goods and services | USD 149 billion |
| Total ecosystem | Over USD 1.4 trillion |
Source: Apple, App Store ecosystem study by Analysis Group, published June 2026, covering 2025
More than 40 of the top 100 apps on the storefront carried consumer-facing AI features in 2025. Apple reports those apps saw 4x more growth in billings than other top 100 apps.
Mobile App Market Growth by Operating System
Counterpoint Research tracks global smartphone sales share by operating system. Android held 75% in Q2 2026, iOS 20% and HarmonyOS 5%.
These are shares of handsets sold in a quarter, not devices in use or app store revenue.
| Quarter | Android | iOS | HarmonyOS |
|---|---|---|---|
| Q3 2024 | 80% | 16% | 4% |
| Q4 2024 | 74% | 22% | 4% |
| Q1 2025 | 76% | 19% | 5% |
| Q2 2025 | 79% | 17% | 4% |
| Q3 2025 | 79% | 17% | 4% |
| Q4 2025 | 72% | 24% | 3% |
| Q1 2026 | 73% | 22% | 5% |
| Q2 2026 | 75% | 20% | 5% |
Source: Counterpoint Research, Global Smartphone Sales Share by Operating System, published August 30, 2026
iOS recorded its highest ever June-quarter share at 20%, which Counterpoint links to steady iPhone 17 demand and the iPhone 17e launch. Android slipped from 79% a year earlier, with Samsung‘s Galaxy S26 series performing better than its predecessor.
HarmonyOS took 24% of China’s smartphone sales in Q2 2026. Global smartphone sales fell 11% year over year in the same quarter.
What Subscription Data Shows About Mobile App Market Growth
RevenueCat’s State of Subscription Apps 2026 draws on more than 115,000 apps and over USD 16 billion in revenue, primarily covering 2025 performance across iOS, Android and web.
Median year-over-year monthly recurring revenue growth was 5.3%. The spread around that median is wide.
| Segment | YoY MRR growth |
|---|---|
| Top quartile | +80% or more |
| Median app | +5.3% |
| Bottom quartile | -33% or worse |
Source: RevenueCat, State of Subscription Apps 2026, published March 2026
Apps launched before 2020 still generate 69% of all subscription revenue in the dataset. Monthly new subscription app launches rose from about 2,000 in January 2022 to more than 14,700 by January 2026.
Paywall Conversion
Hard paywalls convert about five times better than freemium at Day 35, though the hard paywall rate slipped between report editions.
| Paywall type | Day 35 trial-to-paid, 2025 | Day 35 trial-to-paid, 2026 |
|---|---|---|
| Hard paywall | 12.1% | 10.7% |
| Freemium | 2.1% | 2.1% |
Source: RevenueCat, State of Subscription Apps 2025 and 2026 editions
Billing Failures by Store
Involuntary churn splits sharply by storefront. Billing errors account for 31% of Google Play subscription cancellations against 14% on the App Store, up from 28.2% and down from 15.1% respectively a year earlier.
AI apps sustained a 41% Year 1 realized LTV premium over non-AI apps, at a median of USD 30.16 against USD 21.37. AI monthly plans retained 36% worse over 12 months.
What the Mobile App Market Growth Numbers Point To
Install growth of 0.8% against revenue growth of 10.6% is the ratio that matters here. Money is rising far faster than the user base behind it.
The same pattern repeats one level down: median subscription growth of 5.3% sits well below the market total, with the top quartile absorbing most of the gain.
FAQs
How much did consumers spend on mobile apps in 2025?
Consumers spent USD 167 billion on in-app purchases, subscriptions and paid apps across iOS and Google Play in 2025, up 10.6% year over year, according to Sensor Tower’s State of Mobile 2026 report.
Are non-game apps now bigger than games?
Yes, for the first time in Sensor Tower’s tracking. Non-game in-app purchase revenue reached approximately USD 85 billion in 2025, up 21%, against games approaching USD 82 billion, up 1.3%.
Do Reddit threads about stalling app downloads match the data?
Reddit developer threads often flag flat installs. Sensor Tower’s 2025 data supports that: downloads rose 0.8% to nearly 150 billion, while in-app purchase revenue rose 10.6% to USD 167 billion.
Why do Reddit Android developers report more failed subscription payments?
RevenueCat’s 2026 data matches those Reddit reports. Billing errors caused 31% of Google Play subscription cancellations in the dataset, against 14% on the App Store.
Which operating system leads smartphone sales?
Android led with 75% of global smartphone sales in Q2 2026, ahead of iOS at 20% and HarmonyOS at 5%, per Counterpoint Research. This measures handsets sold that quarter, not devices in use.
Sources
https://sensortower.com/blog/state-of-mobile-2026
https://www.apple.com/newsroom/2026/06/app-store-ecosystem-reaches-1-point-4-trillion-usd-as-developers-thrive-globally/
https://counterpointresearch.com/en/insights/global-smartphone-os-market-share
https://www.revenuecat.com/blog/growth/subscription-app-trends-benchmarks-2026
https://www.aboutchromebooks.com/how-many-apps-are-available-for-download/
