

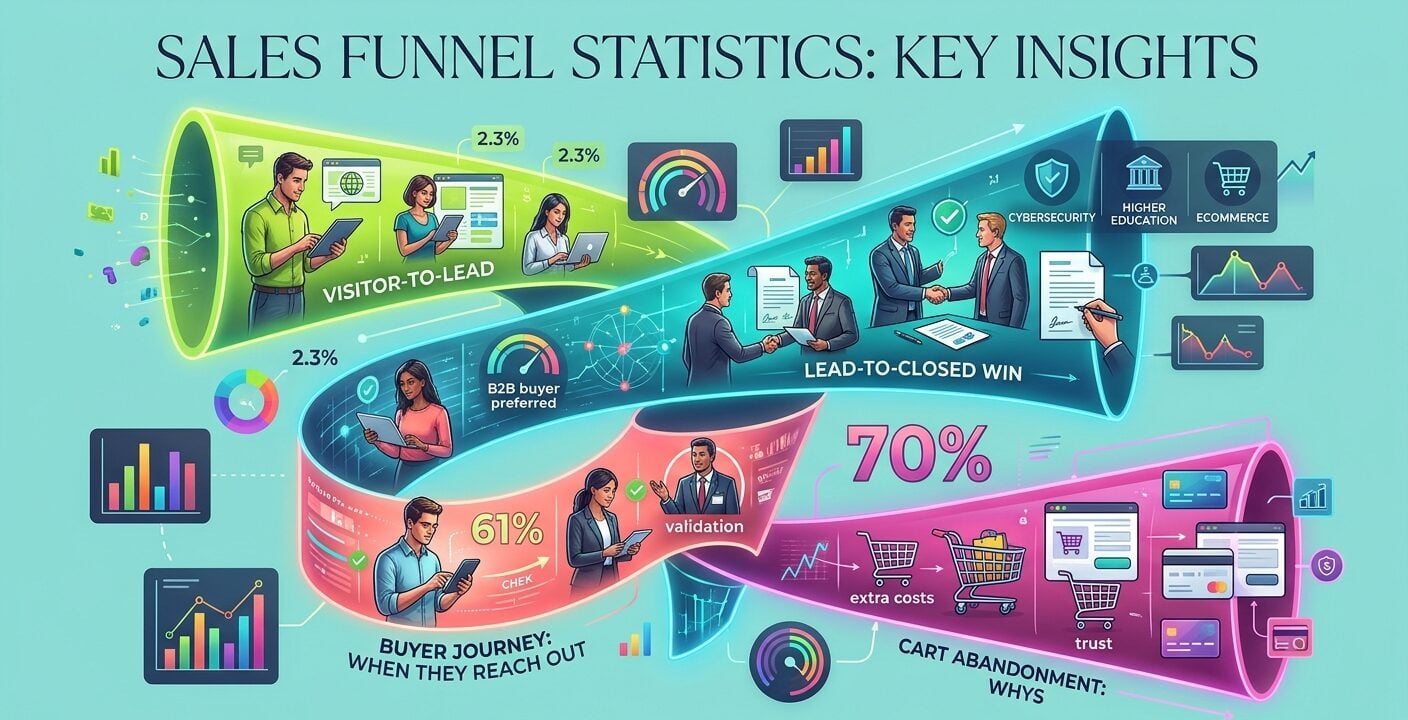
B2B SaaS funnels convert 37% of opportunities into closed deals, while higher education converts 66%, according to First Page Sage’s August 2026 benchmarks across 30 industries. These sales funnel statistics cover stage conversion rates, visitor-to-lead capture, SaaS channel splits, B2B buyer timing, win rates and ecommerce cart abandonment, each drawn from the newest public release of its source.
Sales Funnel Statistics
Sales Funnel Conversion Rates by Stage Across 30 Industries
First Page Sage’s 2026 report, last updated August 10, 2026, tracks four stage-to-stage rates from internal and anonymized client data gathered from 2017 through 2025.
About 65% of those clients were B2B, 20% B2C and 15% served both markets. A deal counts as Closed Won once the contract is signed, before the first payment.
Lead-to-MQL ranges from 17% in Construction to 45% in Higher Education and Solar across the 30 industries.
eCommerce posts the top MQL-to-SQL rate at 58% and the top SQL-to-opportunity rate at 66%.
B2B SaaS has the lowest opportunity-to-closed rate in the report at 37%. Higher Education has the highest at 66%.
Cybersecurity records 24%, 40%, 43% and 46% across the four stages, a funnel profile that sits alongside broader cybersecurity spending and threat data.
| Industry | Lead to MQL | MQL to SQL | SQL to Opportunity | Opportunity to Closed |
|---|---|---|---|---|
| B2B SaaS | 39% | 38% | 42% | 37% |
| Cybersecurity | 24% | 40% | 43% | 46% |
| eCommerce | 23% | 58% | 66% | 60% |
| Financial Services | 29% | 38% | 49% | 53% |
| Higher Education | 45% | 46% | 61% | 66% |
| HVAC | 42% | 51% | 55% | 49% |
| Legal Services | 32% | 35% | 48% | 46% |
| Manufacturing | 26% | 41% | 46% | 51% |
Source: First Page Sage, Sales Funnel Conversion Rate Benchmarks: 2026 Report (updated August 10, 2026), client data 2017–2025
What Share of Website Visitors Become Leads?
Visitor-to-lead rates run from 1.1% to 7.4% in First Page Sage’s B2B industry report, based on client data from January 2022 to August 2025.
The report divides completed conversion actions by total unique website visitors.
Legal Services converts 7.4% of visitors, the highest rate in the table. HVAC Services (3.1%), Staffing & Recruiting (2.9%) and Higher Education & College (2.8%) follow.
Manufacturing sits at 2.2%, Financial Services at 1.9%, IT & Managed Services at 1.5% and Engineering at 1.2%. B2B SaaS and Software Development share the bottom at 1.1%.
These rates come from a different dataset than the stage benchmarks above, so the two should not be multiplied into one end-to-end funnel rate.
Source: First Page Sage, B2B Conversion Rates By Industry – 2026 (updated September 18, 2025), client data January 2022–August 2025
B2B SaaS Sales Funnel Statistics by Channel and Company Size
First Page Sage’s B2B SaaS benchmarks, last updated June 11, 2025, draw on 50+ clients over the past decade, mostly firms in the 10M–100M revenue band of the software-as-a-service market.
The figures assume competent execution of each channel.
By Marketing Channel
LinkedIn leads the five channels at the visitor-to-lead step with 2.2%. SEO MQLs reach SQL at 51%, against 26% for PPC.
Webinars bring in 0.9% of visitors as leads, yet post the top opportunity-to-close rate at 40%. PPC has the lowest rate at four of the five stages.
| Stage | SEO | PPC | Webinar | ||
|---|---|---|---|---|---|
| Visitor to Lead | 2.1% | 0.7% | 2.2% | 1.3% | 0.9% |
| Lead to MQL | 41% | 36% | 38% | 43% | 44% |
| MQL to SQL | 51% | 26% | 30% | 46% | 39% |
| SQL to Opportunity | 49% | 38% | 41% | 48% | 42% |
| Opportunity to Close | 36% | 35% | 39% | 32% | 40% |
Source: First Page Sage, B2B SaaS Funnel Conversion Benchmarks, last updated June 11, 2025
By Target Company Size
Enterprise ($1B+) targets post the lowest rate at four of five stages. MQL to SQL is the exception, where Enterprise tops the table at 40%.
Small Business (1M–10M) targets turn 2.3% of visitors into leads and close 46% of opportunities, the highest figures at both ends of the funnel.
| Stage | Small Business (1M–10M) | Small-to-Midsize (10M–100M) | Middle Market (100M–1B) | Enterprise ($1B+) |
|---|---|---|---|---|
| Visitor to Lead | 2.3% | 1.4% | 1.2% | 0.7% |
| Lead to MQL | 37% | 41% | 40% | 34% |
| MQL to SQL | 32% | 39% | 39% | 40% |
| SQL to Opportunity | 40% | 42% | 46% | 36% |
| Opportunity to Close | 46% | 39% | 35% | 31% |
Source: First Page Sage, B2B SaaS Funnel Conversion Benchmarks, last updated June 11, 2025
The B2B SaaS row in the 2026 cross-industry report comes from a separate dataset, so its rates differ from these.
61% of the Way In: When B2B Buyers First Contact Sellers
B2B buyers first contacted sellers 61% of the way through their buying journey in 6sense’s 2025 Buyer Experience Report, down from 69% in its 2023 and 2024 studies.
6sense puts the shift at six to seven weeks earlier. The survey covered nearly 4,000 buyers in North America, APAC and EMEA, with a median purchase of $200,000 to $300,000.
| Buyer metric | 6sense 2023–2024 studies | 6sense 2025 study |
|---|---|---|
| Average buying cycle | 11.3 months (2024) | 10.1 months |
| Point of first seller contact | 69% of journey | 61% of journey |
| First contact initiated by buyer | 82% | 79% |
| Winner was on Day One shortlist | 85% | 95% |
| Vendors evaluated | 4.5 | 5.1 |
| Vendors buyer had prior experience with | 3.2 | 3.8 |
Source: 6sense, 2025 B2B Buyer Experience Report, survey of nearly 4,000 B2B buyers, published November 2025
The shorter cycle coincided with more physical-goods purchases in the 2025 sample. 6sense says the drop is partly due to sample composition, though time spent per vendor also fell in each solution category.
Before contacting any seller, 94% of buyers had ranked their shortlist. The first vendor contacted won 77.0% of deals in the main survey (n=3,744).
94% of buyers used LLMs, the models behind most AI chatbot tools, during the purchase. In a companion survey of 766 buyers, 58% said they engaged sellers earlier to check how vendors had built AI into their products, and 89% bought solutions with AI features.
Source: 6sense, 2025 B2B Buyer Experience Report and companion survey (n=766), 2025
Do B2B Buyers Still Want Sales Reps in the Funnel?
Yes, at specific points. Gartner’s survey of 645 B2B buyers, fielded August through September 2025, found 69% prefer to validate AI-generated insights with a sales rep.
The same buyers favor self-service overall: 67% prefer a rep-free experience and 70% prefer a completely digital, self-service purchase.
Gartner reports a strong preference for low-friction, self-directed buying, a theme that also runs through enterprise digital transformation statistics.
45% used GenAI during a recent purchase, mainly to gather vendor and product information. Buyers drew on an average of seven information sources.
Trust splits close to even. 51% say they are more likely to get misleading information from GenAI, and 49% say the same of sales reps.
Gartner says reps remain the top information source when buyers research a business need, pick a preferred supplier and finalize the purchase. A March 2026 Gartner release on the same fieldwork reported 646 respondents.
Source: Gartner, press release May 20, 2026, survey of 645 B2B buyers fielded August–September 2025
Win Rates at the Bottom of the Sales Funnel: Expansion vs New Business
| Deal metric | New business | Expansion |
|---|---|---|
| Win rate | 18% | 45% |
| Average sales cycle | 91 days | 52 days |
| Stakeholders involved | 8 | 5 |
Source: Ebsta and Pavilion, 2025 GTM Benchmarks, $48Bn in opportunities from UK and US tech firms, 2024 data
Existing customers produced 52% of new revenue in 2024 across Ebsta’s dataset.
Win rates fell 10% in 2024 after an 18% drop in 2023. Sellers missing quota rose from 69% to 78% over those two years, while slipped deals fell from 44% to 36%.
Ebsta, which plugs into CRMs such as Salesforce and HubSpot, found 44% of sales contacts never made it into the CRM. A quarter of those missing contacts sat at CxO level.
Channel Efficiency
Ebsta scores channel efficiency as win rate multiplied by ACV, divided by sales cycle length.
Partner referrals score 1.3x, organic inbound 1.2x, outbound 1.05x, events 0.78x and paid 0.68x.
Ebsta’s site now points to a 2026 edition published by Fullcast, built on $78B in pipeline, 361,000 opportunities and 2,500 sellers. Its detailed figures sit behind a registration form, so the 2025 report is the latest public release.
Source: Ebsta and Pavilion, 2025 GTM Benchmarks, 2024 opportunity data
70.22%: Average Cart Abandonment in Ecommerce Sales Funnels
Online shoppers abandon 70.22% of carts on average, based on 50 studies compiled by Baymard Institute and last updated September 22, 2025.
The studies date from 2006 to 2025. Uptain’s 2025 report, the newest on the list, records 71.72%, while older entries include Adobe‘s 2016 reading of 75.50%.
Why Shoppers Abandon Checkout
Baymard’s reasons study excludes the 42% of US shoppers who abandoned because they were just browsing. Respondents could pick several reasons, so shares exceed 100% combined.
| Abandonment reason | Share of US online shoppers |
|---|---|
| Extra costs too high (shipping, tax, fees) | 40% |
| Delivery was too slow | 20% |
| I didn’t trust the site with my credit card information | 19% |
| The site wanted me to create an account | 18% |
| Too long / complicated checkout process | 17% |
| Website had errors / crashed | 17% |
| Returns policy wasn’t satisfactory | 13% |
| I couldn’t see / calculate total order cost up-front | 12% |
| The credit card was declined | 10% |
| There weren’t enough payment methods | 9% |
Source: Baymard Institute, reasons-for-abandonment study cited in its cart abandonment list (updated September 22, 2025)
Extra costs lead at 40%. Slow delivery follows at 20%, and distrust of the site with card details at 19%.
The average US checkout shows 23.48 form elements by default, or 14.88 form fields. Baymard’s testing finds 12 to 14 elements, or 7 to 8 fields, is enough.
Baymard estimates large ecommerce sites can raise conversion rates by 35.26% through checkout design alone. It values that at $260 billion in recoverable orders, out of $738 billion in combined US and EU ecommerce sales.
Source: Baymard Institute, Cart Abandonment Rate Statistics, last updated September 22, 2025
FAQs
What is a good sales funnel conversion rate?
It depends on the stage and industry. For B2B SaaS, First Page Sage’s August 2026 report lists 39% lead-to-MQL, 38% MQL-to-SQL, 42% SQL-to-opportunity and 37% opportunity-to-closed.
What percentage of website visitors become leads?
Between 1.1% and 7.4% across B2B industries, based on First Page Sage client data from January 2022 to August 2025. Legal Services leads at 7.4%; B2B SaaS and Software Development sit at 1.1%.
When do B2B buyers contact sales?
About 61% of the way through the buying journey, according to 6sense’s 2025 survey of nearly 4,000 buyers. Its 2023 and 2024 studies put first contact at 69%, six to seven weeks later.
What is the average cart abandonment rate?
Roughly seven in ten carts. Baymard’s average across 50 studies is 70.22%, last updated September 22, 2025, and Uptain’s 2025 report, the newest on its list, records 71.72%.
Are sales funnel benchmarks shared on Reddit reliable?
Treat them as single-company anecdotes. Published benchmarks define each stage and state a data window; First Page Sage’s 2026 funnel report, for example, uses client data from 2017 through 2025.
Sources
https://firstpagesage.com/seo-blog/sales-funnel-conversion-rate-benchmarks-report/
https://6sense.com/science-of-b2b/buyer-experience-report-2025/
